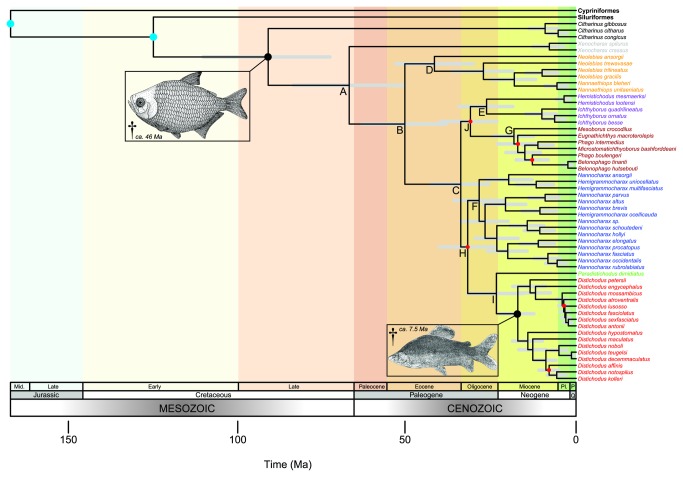
Figure 8. Time-scaled citharinoid phylogeny.
This chronogram was inferred using both primary (with “intermediate” priors) and secondary calibrations (Analysis 1; Table 3). Primary calibration nodes are indicated by black dots and linked to a figure representing the fossil. Secondary calibration nodes are indicated by blue dots. Divergence-time estimates are represented by the mean ages of clades. Gray bars correspond to 95% highest posterior density (HPD) intervals of mean node ages. Terminal taxa are colored by generic/suprageneric clade membership, following the color scheme of Figures 4-7. All nodes resulted in posterior probabilities (PP) larger than 0.95, except for those labeled in red, for which PP < 0.75.

