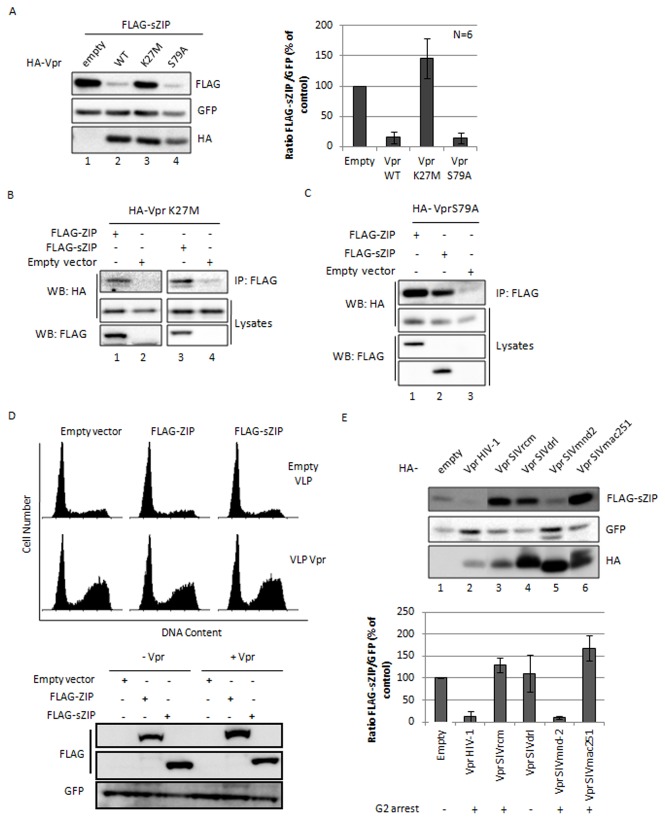
Figure 4. Vpr-mediated sZIP degradation does not correlate with the G2 arrest-independent cytotoxicity activity of Vpr, nor with its ability to trigger G2 arrest.
A. Characterization of Vpr mutants for their ability to trigger the degradation of sZIP. HeLa cells were co-transfected with vectors expressing FLAG-sZIP and the indicated HA-tagged Vpr proteins and a GFP expression vector as an internal control (ratio 10:1). Cells were harvested 48h post-transfection, lysed and proteins expression was analysed by Western Blot. The top panel displays the results of one representative experiment. The bottom panel shows the quantification of the ratio between FLAG and GFP signals for several independent experiments. B and C. G2 arrest-defective Vpr mutants, VprK27M and VprS79A, still interact with ZIP and sZIP. HEK293T cells were transfected with vectors expressing HA-tagged Vpr mutants, VprK27M (B) and VprS79A (C), and a vector expressing the indicated FLAG-tagged proteins. Cell lysates were prepared 48h post-transfection and subjected to immunoprecipitation using anti-FLAG antibodies as described in Figure 1B. D. Overexpression of ZIP or sZIP does not overcome Vpr-mediated G2 arrest. HeLa cells were co-transfected with vectors expressing either FLAG-ZIP or FLAG-sZIP along with a vector expressing the GFP protein. 24h post-transfection, the cells were incubated with empty VLP or VLP containing wt Vpr protein for 2 h (800 ng GAG CAp24 per VLP). The cells were harvested 18h after the VLP treatment. Half the cells were fixed, stained with propidium iodide and analyzed by flow cytometry to monitor the DNA content of the GFP-positive population (top panel). The other half of the cells were lysed and protein expression was analyzed by Western Blot (bottom panel). E.The Vpr-induced sZIP degradation has some Vpr-species specificity (which does not correlate with Vpr-species specificity towards cell cycle arrest). HeLa cells were co-transfected with a vector expressing FLAG-sZIP together with a vector expressing the indicated HA-tagged Vpr proteins. GFP was used as an internal control as in A. Cells were harvested 48h post-transfection, lysed and protein expression was analyzed by Western Blot (top panel). The bottom panel shows the ratios between FLAG and GFP signals. The G2 arrest activity of each Vpr protein in Hela cells is indicated below the histogram.

