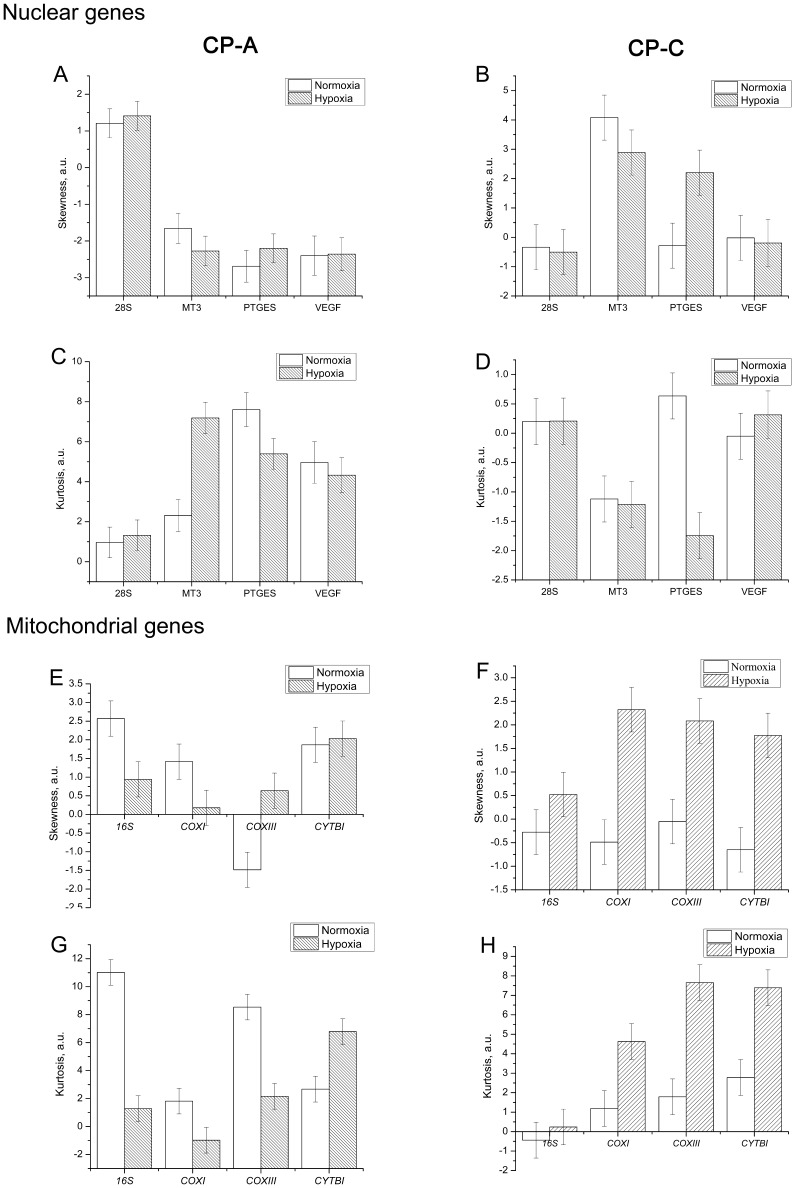
Figure 4. Single-cell expression levels distributions parameters of the studied mitochondrial and nuclear genes in normoxic and hypoxic metaplastic (CP-A) and dysplastic (CP-C) cells.
Comparison of distribution skewness (A, B, E, F) and kurtosis (C, D, G, H) values of the single-cell gene transcription level distributions between normoxic and hypoxic conditions. A clear trend of increased both skewness and kurtosis of mitochondrially-encoded gene expression distributions can be seen in CP-C cells in response to hypoxia, but is absent in CP-A cells. Among the studied nuclear genes only the PTGES gene showed significant changes in skewness and kurtosis parameters in CP-C cells.

