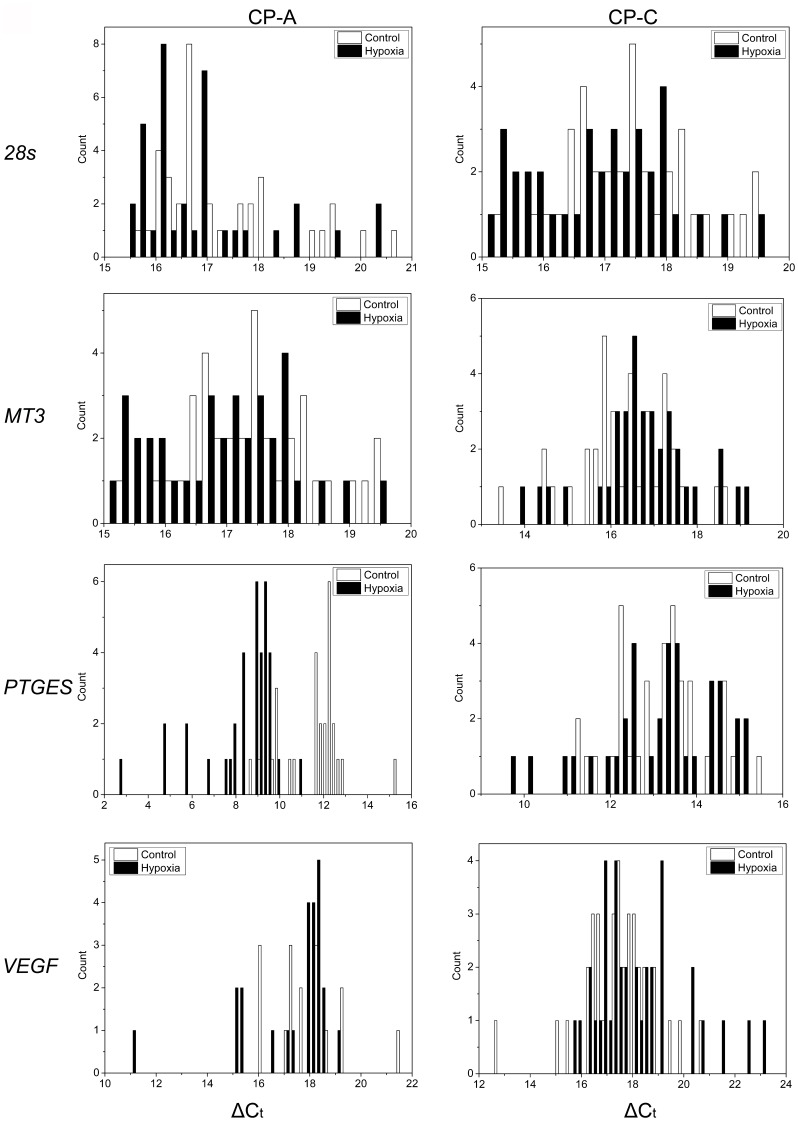
Figure 5. Expression levels of mitochondria and nucleus encoded genes in single control and hypoxia-treated CP-A and CP-C cells.
Histograms of gene expression levels in control (empty bars) and hypoxia-treated (30 minutes, solid bars) cells. The distribution histograms were generated using the same bin size.

