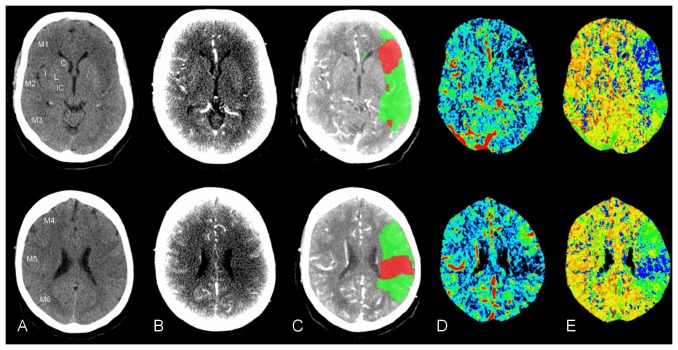
Figure 1. NCCT, CTA-SI and CTP in a patient with acute stroke.
A 67-year-old male with aphasia and right-sided hemiparesis. Imaging approximately 1 hour after symptom onset. The upper row corresponds to the ganglionic ASPECTS level (C, caudate nucleus; L, lentiform nucleus; IC, internal capsule; I, insular region; M1–M3, cortical regions), the lower row to the supraganglionic ASPECTS level (M4–M6, cortical regions). Ischemic signs in the left MCA territory are seen on (A) NCCT; (B) CTA-SI; and on CTP in (C) penumbra and infarct maps; (D) CBV maps; and (E) MTT maps.

