
Figure 1. H. pylori colonization and induced gastritis.
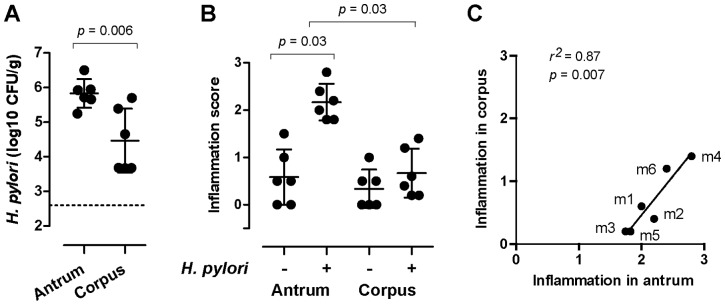
(A) Average density of H. pylori in the antrum and corpus of individual monkeys. The p-value shown is from a paired t-test. A dashed line indicates the limit of detection. (B) Average inflammation scores for each monkey before (−4, −2 weeks) and after (2,4,8,11,16 weeks) H. pylori inoculation. The p-value shown is from a Wilcoxon matched-pairs signed rank test. (C) Linear regression analysis of the average post-H. pylori inflammation score observed in the antrum and corpus of each animal. All panels show samples from m 1–6.