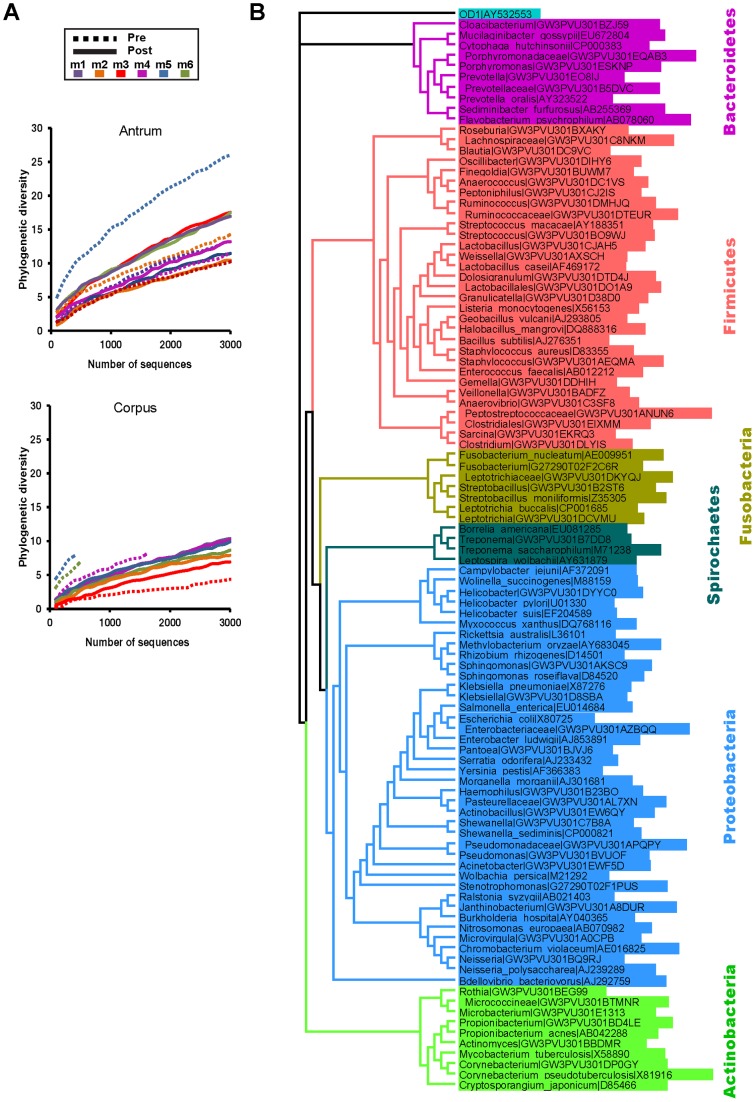
Figure 2. Bacterial diversity in the rhesus macaque stomach.
(A) Rarefaction curves of phylogenetic diversity with increasing sequence depth. The diversity, calculated from increasingly large pools of reads sub-sampled without replacement, was plotted against the number of reads sampled from the antrum (top) and corpus (bottom) of each animal before (Pre) and after (Post) H. pylori inoculation. m6 Pre (antrum) and m 1–2 Pre (corpus) libraries did not pass quality filters and are not shown. (B) An approximately-maximum-likelihood phylogenetic tree of the 55 phylotypes that account for at least 1% of any individual library (reads identified by |GW3 or |G27 designations), as well as representative members of each phylum which were used to build the tree (|GenBank accession number). Each phylum is indicated by highlighting in a different color. OD1 was included as an outgroup.

