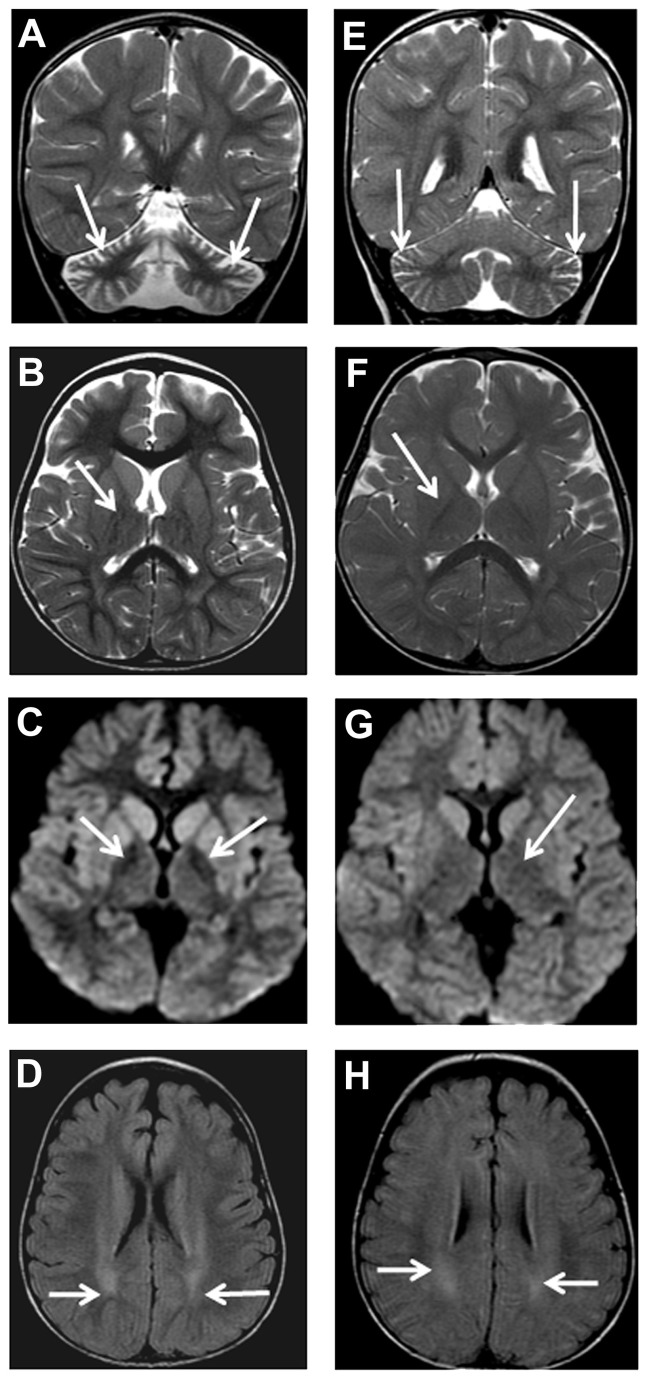
Figure 1. Patient F2 (P1) MRI, age 3 years 3 months (A-D).
Coronal T2-weighted (A), axial T2-weighted (B), axial diffusion (C), axial FLAIR (D) showing cerebellar atrophy (arrows) with widening of cerebellar folia (A), T2 normal signal intensity (arrows) of globus pallidus (B), highlighted subtle iron deposition at globus pallidi (arrows) as reduction in signal intensity (C), and high signal intensity (arrows) at cerebral white matter (D). Patient F2 (P2) MRI, age 1 year 3 months (E-H)). Coronal T2-weighted (E), axialT2-weighted (F), axial diffusion (G), axial FLAIR (H) showing mild cerebellar atrophy (arrows) with mild widening of cerebellar folia (E), normal signal intensity (arrows) of globus pallidus (F and G), and high signal intensity (arrows) at cerebral white matter (H).

