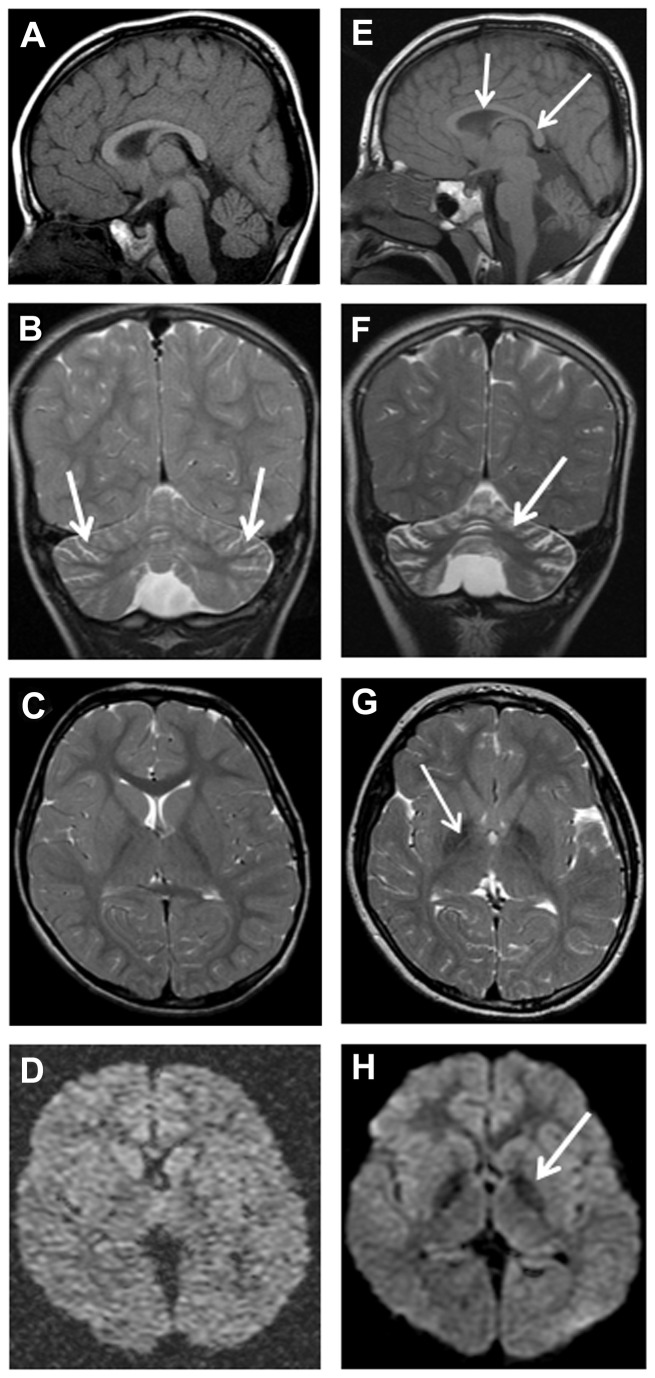
Figure 2. Patient F5 (P1) MRI, age 4 years 2 months (A-D), and 7 years 6 months (E-H).
Sagittal T1-weighted (A and E), coronal T2-weighted (B and F), axial T2-weighted (C and G) and axial diffusion (D and H) sequences showing mild cerebellar cortical atrophy with mildly prominent folia (arrows in C). There is also simple corpus callosum (arrows in E). (F) Coronal T2-weighted reveals progressive cerebellar cortical atrophy and gliosis, with widening of folia and increased signal in the residual cerebellar cortex (arrow). Axial T2-weighted (G), and axial diffusion (H) sequences highlight iron deposition as reduction in signal intensity in the globus pallidi (arrows).

