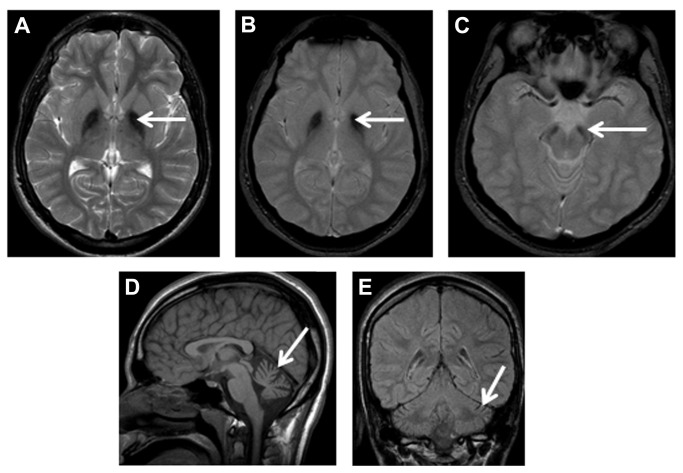
Figure 3. Patient F6 (P3) MRI, age 17 years 5 months.
Axial T2-weighted (A), axial gradient (B and C), sagittal T1-weighted (D) and coronal fluid-attenuated inversion recovery (FLAIR, E) sequences highlight iron deposition as reduction in signal intensity in the globus pallidi (arrows in A and B) and substantia nigra (arrow in C). There is also cerebellar cortical atrophy with increased CSF spaces around the cerebellum (arrows in D and E).

