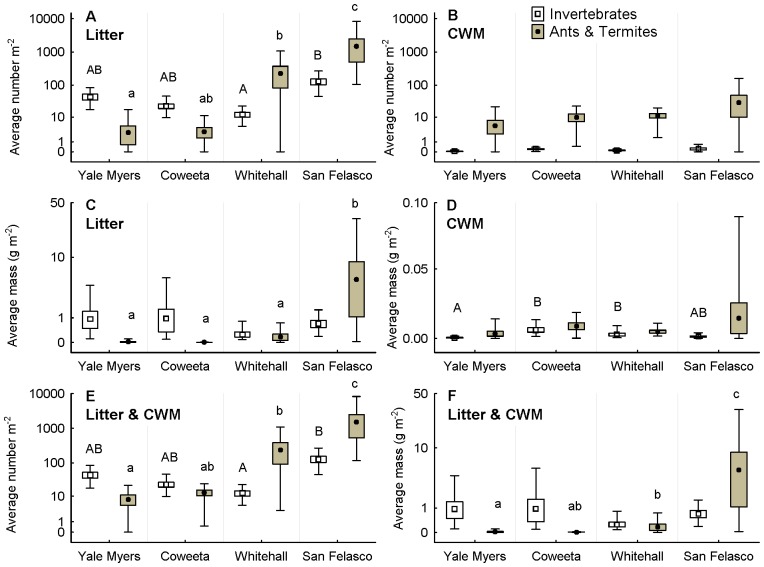
Figure 2. Macroinvertebrate biomass and abundance varied across sites, taxa, and habitats.
(A) Average number of non-social invertebrates (not including ants and termites) and social insects (ants and termites) m−2 in litter samples and (B) in coarse woody material (CWM) samples. Average ants and termites m−2 differed among some sites in litter samples (A) but not in CWM (B). (C) Average dry mass of non-social invertebrates and social insects m−2 in all litter samples and (D) in CWM samples. Social insects were more abundant in San Felasco in litter samples (C) while non-social invertebrates only varied among some sites in CWM samples (D). In combined litter and CWM samples, the abundance (E) of both groups varied among sites, while only social insects varied in biomass (F). In both cases, the southern sites had higher numbers and masses of social insects (E and F). Points = mean, bars = +/− SE, and whiskers = range. The Y-axis is log10 scaled. Letters above whiskers represent differences revealed through multiple comparisons. Shared letters of the same case (upper vs. lower) indicate no significant differences. Box plots without letters had no significant pairwise difference (Tukey-Kramer adjustment, P>0.05).

