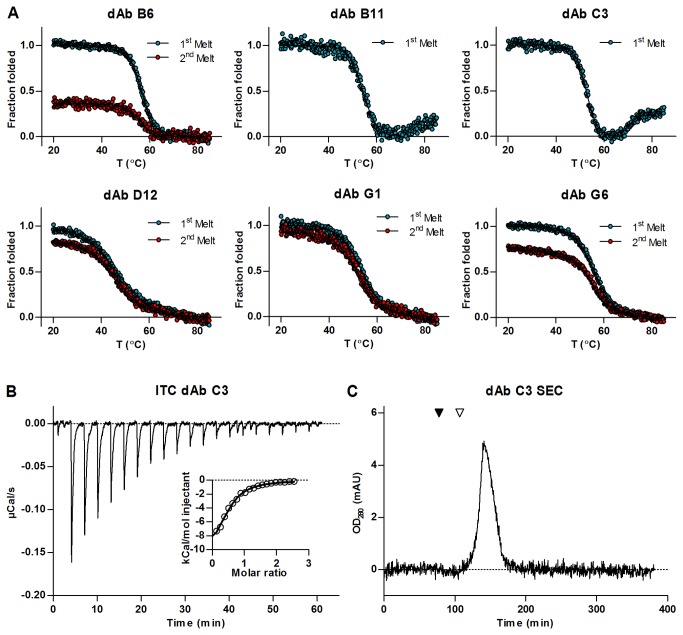
Figure 7. Biophysical evaluation of isolated antibodies and affinity measurement for C3 against hen egg lysozyme.
(A) Thermal unfolding and refolding for the lysozyme binding clones assayed by circular dichroism spectroscopy. The first melting curve for each clone is shown in blue, and the subsequent melting curve in red. After recording the first melting curve the antibodies were allowed to cool, and the experiment was repeated using the refolded antibodies. (B) Recorded heat change over time during successive injections of lysozyme into the cell containing C3 domain antibody. The insert shows the integrated injection heats as a function of molar ratio of the lysozyme to the antibody. Circles are the integrated signal from the larger panel, and the best fit of the 1:1 binding equation to the observation is shown as a line. The figure is representative for the three measurements performed. (C) Chroatogram from size exclusion chromatography of C3 antibody. The migration of two size markers is shown in the chromatogram; albumin (black triangle) with a size of 66 kDa, and TEV-protease (white triangle) with a size of 26 kDa. The single elution peak of the antibody well below the 26 kDa reference protein indicates that it exhibits a monomeric state in solution.

