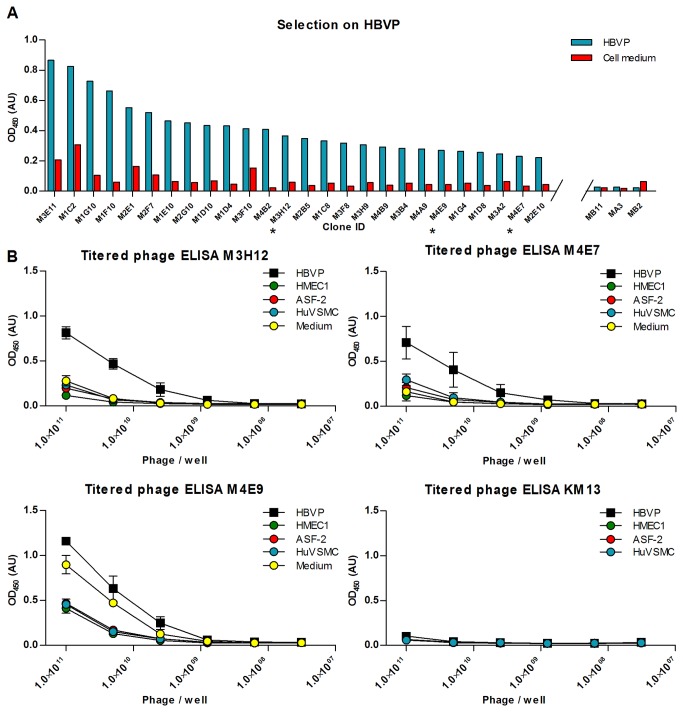
Figure 8. Screening ELISA from selection on HBVP cells and antibody-phage ELISA dilution series on HBVP.
(A) The clones shown are the ones for which the signal on HBVP-cells was highest, and for which the signal on cell medium did not exceed 25% of the signal on cells. The three clones with the lowest signal among the 384 clones screened are shown for comparison. Blue bars depict the signal on HBVP cells, whereas signal on medium is depicted in red. The result was obtained after one round of selection on immobilized HBVP cells. Clones marked with an asterisk were examined further in titered ELISA. (B) Three of the clones from the screening ELISA were tested further in a titered phage ELISA in microwells. The x-axis of the graphs depicts the titer for serial dilutions of the phages displaying the selected domain antibodies, and the y-axis depicts the ELISA signal. The signal on HBVP cells is marked with boxes, while the signal on various decoy cells and on cell medium is marked with circles. The error bars show one standard deviation calculated on the basis of three independent experiments.

