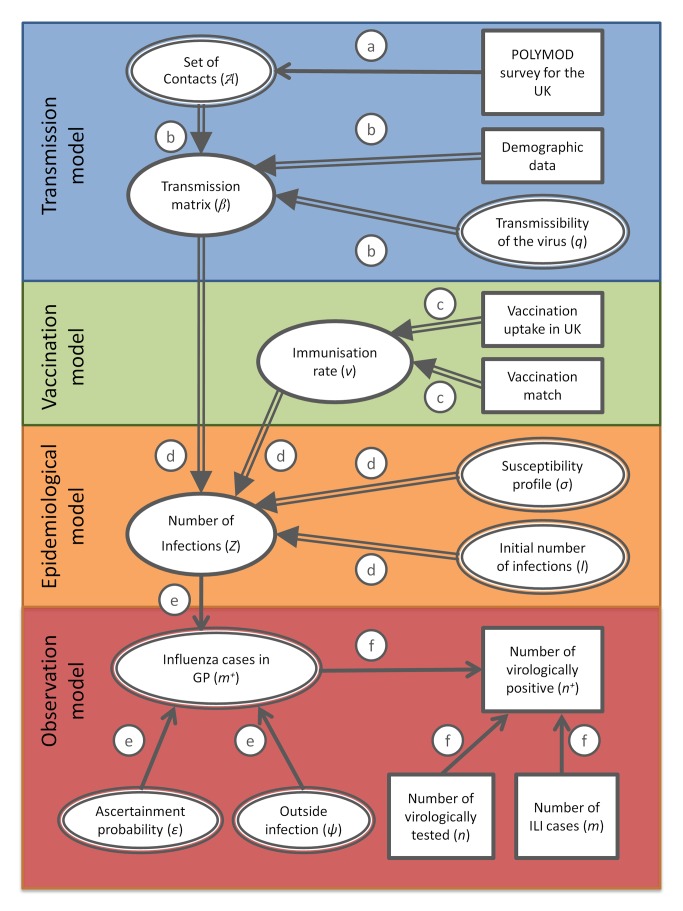
Figure 1. Directed acyclic graph showing the link between the different modelling components, data, and parameters.
Double and simple arrows indicate, respectively, deterministic and stochastic relationships, ellipses indicate variables, and rectangles indicate data. The circled letters indicate which relationship connects the variables or data involved. These relationships are as follows: process a, drawing with replacement; process b, calculation of the transmission matrix by rescaling the mixing matrix obtained by reweighting for age and weekday and weekend days; process c, derivation of the immunisation rate from uptake data and match of vaccine; process d, integration of the SEIR model of transmission; process e, ascertainment of cases through ILI recording at GPs; process f, virological testing scheme following a hypergeometric distribution.

