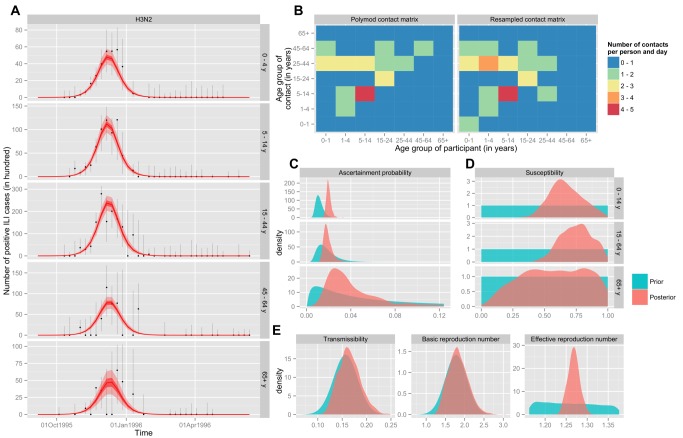
Figure 4. Inference results for H3N2 during the 1995/1996 season.
(A) Comparison of the fit of the model to the age-specific time series of positive ILI cases estimated from the data. For the model, the mean (red line) with 50% and 95% CIs (light and dark shaded areas, respectively) is based on the associated binomial process. For the data, we have represented the unbiased estimator (black dots), with the 95% CI associated with the hypergeometric distribution (error bars). (B) Comparison of the contact matrix of the POLYMOD study (left panel) to the resampled matrix of the maximum likelihood MCMC sample (right panel). (C) Age-specific probability of being recorded as ILI and positive if tested and infected. (D) Age-specific susceptibility at the beginning of the flu season. (E) Transmission coefficient (q, left panel) and derived quantities: basic (R 0, middle panel) and effective (Re(t = 0), right panel) reproduction numbers. For (C–E): the prior distribution is shown in blue, and the posterior distribution in red.

