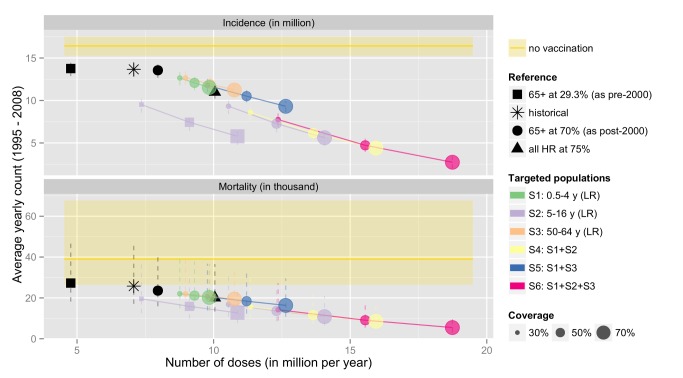
Figure 6. Estimated number of influenza cases and deaths occurring over the 14-y period under the actual vaccination programme, and a series of alternatives.
The horizontal axis gives the size (number of doses given) of each of the alternative vaccination programmes (S1 to S6—defined as incremental on the current programme). HR and LR refer to the high-risk and low-risk groups, respectively. The black square represents the estimate of what would have happened if England and Wales had maintained its risk-group-specific vaccination programme throughout the period. The black circle represents what would have happened if the post-2000 programme (targeting vaccination to high-risk and elderly individuals) had been in place throughout the period. The actual vaccination programme is given by the asterisk. Coloured circles represent additions to the current strategy (i.e., extending vaccination to low-risk non-elderly individuals), and coloured squares represent alternative extensions to the pre-2000 programme (i.e., if instead of extending vaccination to low-risk elderly individuals, vaccination had been offered to low-risk individuals in other age groups). The size of the coloured circles and squares represents the assumed coverage achieved, and the different colours represent which age groups are targeted.

