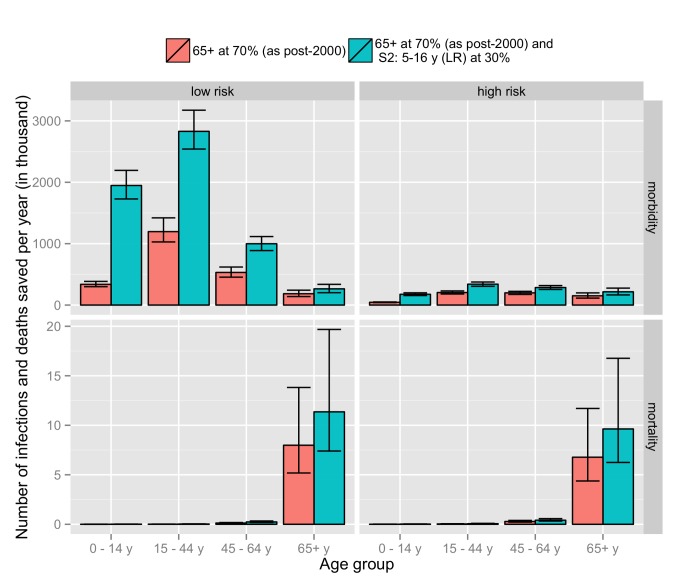
Figure 7. Comparison of the number of cases saved per year for the current strategy (vaccination of high-risk and 65+-y individuals) with an extension of the current strategy that additionally targets the 5–16-y age group.
Results are shown for number of infections (morbidity) and deaths (mortality) by age and risk group.

