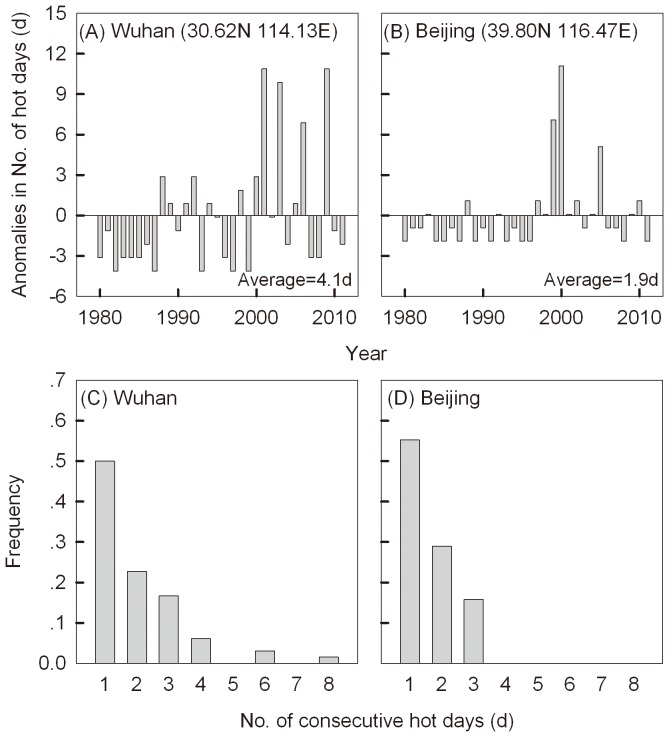
Figure 1. Hot days (DTmax ≥37°C) in June-August at Wuhan and Beijing from 1980–2011.
Anomalies in the number of hot days (to the average form 1980–2011) at Wuhan (A) and Beijing (B) and the frequency of the consecutive hot days at Wuhan (C) and Beijing (D). Daily maximum temperature records were downloaded from the China Meteorological Data Sharing Service System. High temperatures 10 cm above ground and shadowed with Brassica leaves in fields recorded with data-loggers are normally 3°C higher than temperatures recorded at weather stations at Wuhan.

