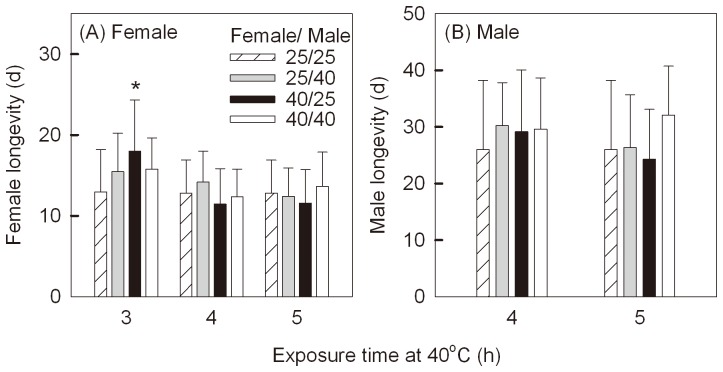
Figure 3. Mean longevity (±SD) after different treatments.
(A) and (B) show females and males respectively. Treatments involved combinations of females and males exposed to control (25°C) or stress (40°C) treatments for 3, 4 or 5 h. In the control group, both sexes were held at 25°C. “*”indicate significant differences (P<0.05) from the controls (both sexes at 25°C).

