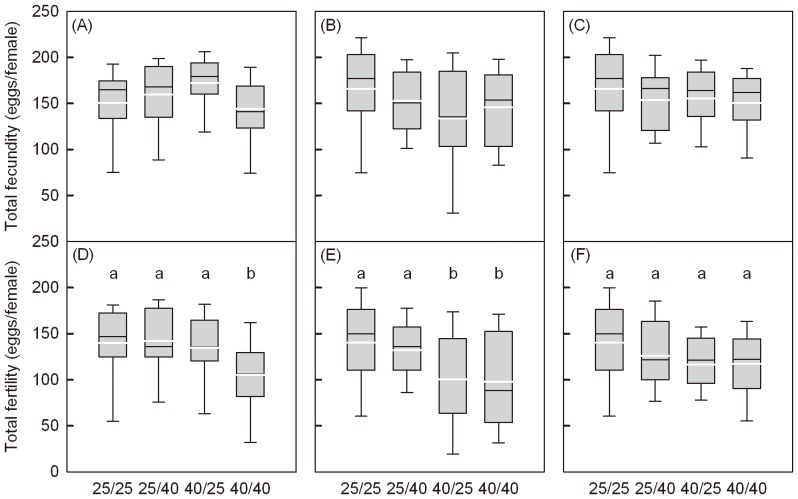
Figure 5. Box plots for total fecundity and fertility after adults heat stress.
(A–C) refers to total fecundity and (D-E) to fertility per female. Treatments involved combinations of females and males exposed to control (25°C) or stress (40°C) for different exposure times of 3 h (A, D), 4 h (B, E) or 5 h (C, F). Different lowercase letters indicate significant differences between four treatment groups.

