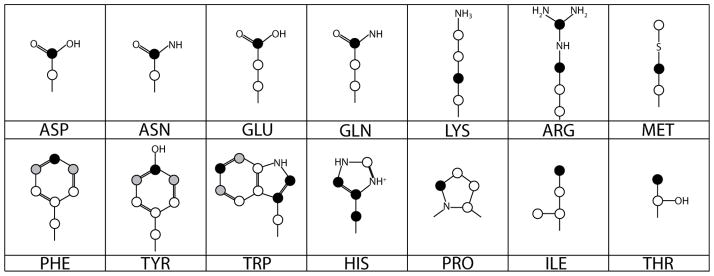
Figure 1.

Diagram of the expected side chain distribution of 13C from [1-13C] acetate. Black circles identify heavily labeled sites and gray circles identify sites that are labeled more lightly because symmetric carbons of 3-dehydroquinate can arise equally from labeled and unlabeled carbons of erythrose 4-phosphate in the shikimate pathway.
