
Figure 5.
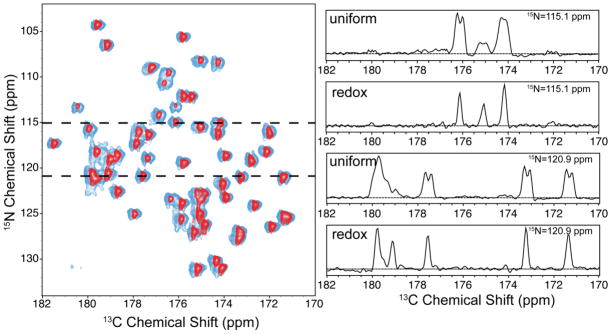
Comparison of 2D 15N-13C ZF-TEDOR spectra of uniformly labeled and redox-labeled GB1. Left: spectrum for the redox-labeled sample (dark shade) superimposed on the spectrum for the uniformly labeled sample (light shade). Right: selected slices at 15N frequencies of 115.1 ppm (top two slices) and 120.9 ppm (bottom two slices). Spectra were recorded at 18.0 kHz MAS, 800 MHz 1H Larmor frequency. The full spectra are shown in Figure S3.