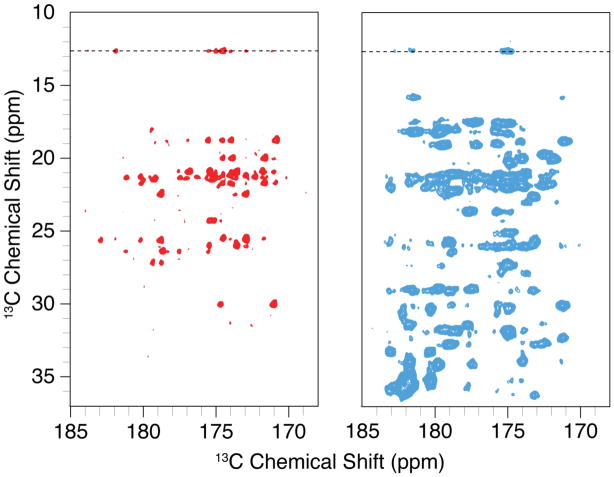
Figure 6.
12.4 ms RFDR 13C-13C 2D spectra comparing redox-labeled GB1 (left) with uniformly labeled GB1 (right). These expansions show the CO-aliphatic region of the spectrum, which is typically very crowded for uniformly labeled samples. Each experiment was acquired at 18 kHz MAS with 8 scans per point for a total time of approximately 8 hours per experiment. Both spectra were processed with identical parameters and displayed at the same contour level. Traces along the dotted line at 12.7 ppm are shown in Figure 7. The full spectra are shown in Figures S1 and S2.

