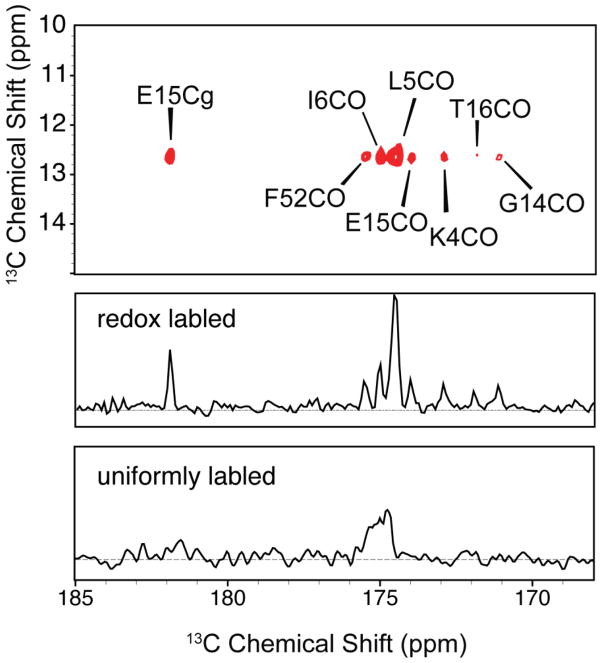
Figure 7.
Details from Figure 6 associated with the CD resonance of Ile 6 at 12.7 ppm. Top panel: expansion of the RFDR spectrum for the redox-labeled sample, showing 8 unique cross peaks, including several corresponding to long-range, through space contacts. Middle and bottom panels: 1D traces through 12.7 ppm for redox-labeled GB1 (middle panel) and uniformly labeled GB1 (bottom panel).

