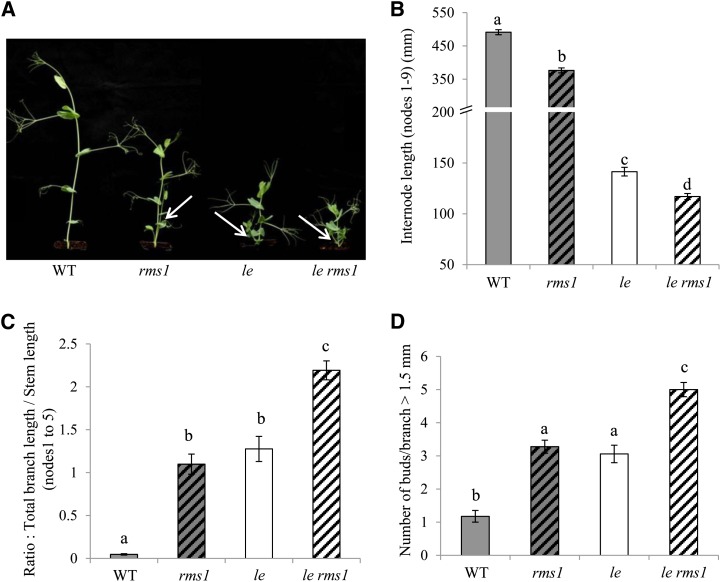
Figure 5.
The effect of the rms1-10 and le mutations on both internode length and branching is additive. A, Fifteen-day-old wild-type (WT), rms1, le, and le rms1 plants. White arrows indicate the basal branching. B, Internode length between nodes 1 and 9. Data are means ± se (n = 18). Values with different lowercase letters are significantly different from one another (ANOVA, P < 0.01). C, Ratio of total branch length to total stem length (n = 18). Values with different lowercase letters are significantly different from one another (ANOVA, P < 0.001). D, Number of buds or branches from nodes 1 to 5 with a length greater than 1.5 mm (n = 18). Values with different lowercase letters are significantly different from one another (ANOVA, P < 0.001). [See online article for color version of this figure.]

