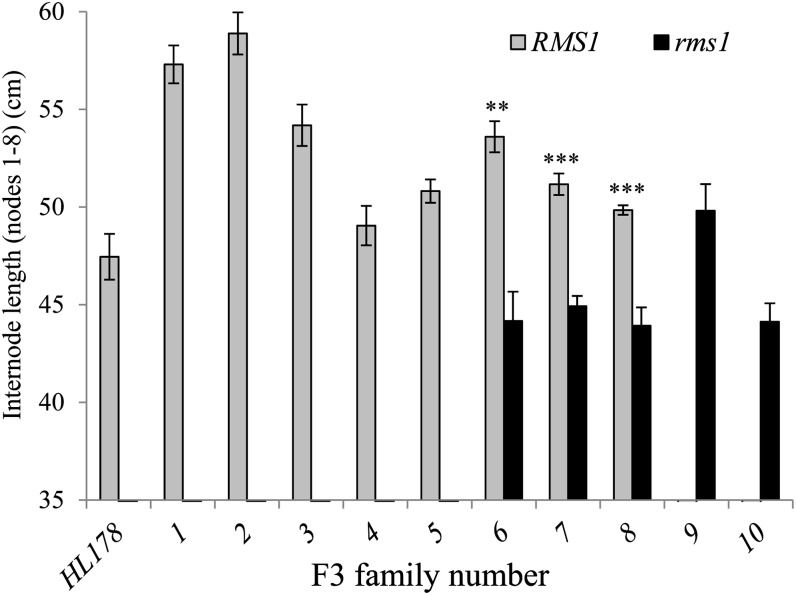
Figure 8.
SLs control internode elongation in a della background. Internode length between nodes 1 and 8 were measured in the della line HL178 (la cry-s) and in F3 della families fixed for la cry-s and fixed for RMS1 (1–5) or rms1 (9 and 10) or segregating for RMS1/rms1 (6–8). For families 6 to 8, the gray bars correspond to a mixture of RMS1/RMS1 and RMS1/rms1 plants (n = 11–28 except for rms1 F3 6–8, for which n = 6–8). Asterisks denote significant differences from corresponding rms1 plants (**P < 0.01, ***P < 0.001, Student’s t test).

