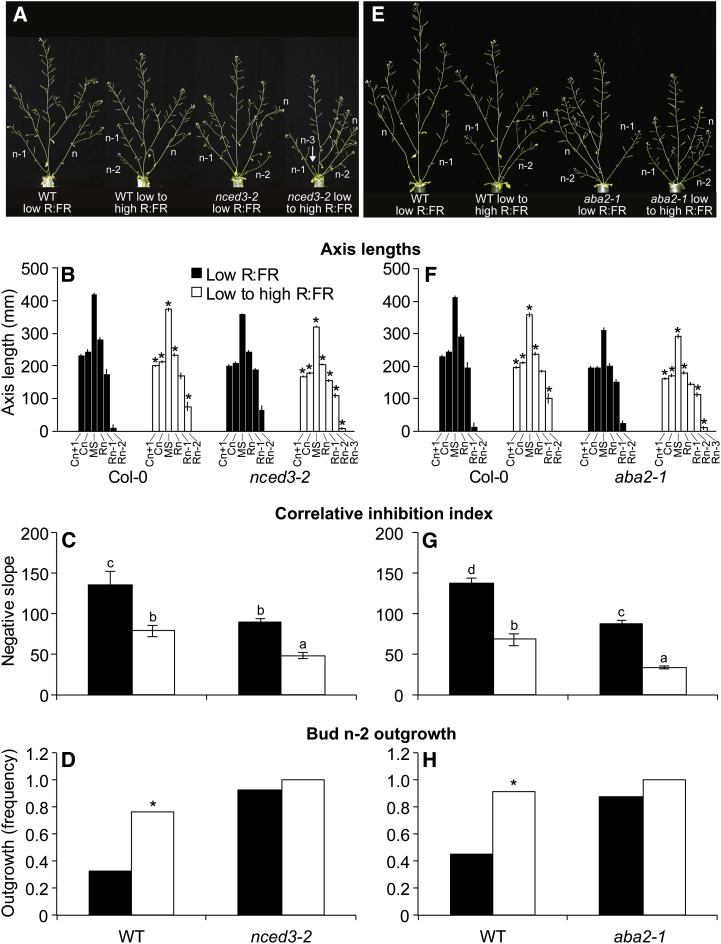
Figure 6.
A, B, E, and F, Phenotypes (A and E) and axis lengths (B and F) of wild-type Col-0 and nced3-2 (A and B) and aba2-1 (E and F) grown under low R:FR and then either maintained under low R:FR or provided with high R:FR at 3 DPA, measured at 10 DPA. Cn, Cauline branch; MS, main shoot; Rn, rosette branch; WT, wild type. C, D, G, and H, Correlative inhibition index (C and G) and frequency of bud n-2 outgrowth (D and H) of wild-type Col-0 and nced3-2 (C and D) and aba2-1 (G and H) grown as above, assessed at 10 DPA. Bars with different letters are significantly different at α < 0.05. Asterisks indicate significant differences between R:FR treatments at α < 0.05. Data are means ± se with n = 30 (nced3-2) or 24 (aba2-1). [See online article for color version of this figure.]

