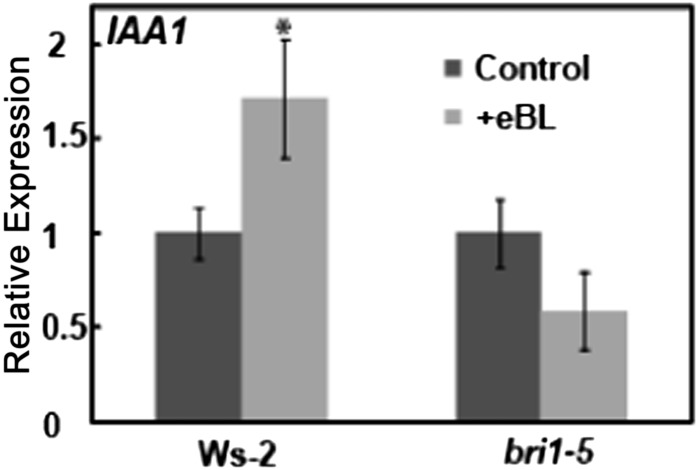
Figure 6.
Effects of BR application to wild-type Ws-2 and bri1-5 plants on IAA1 expression. Results are presented as means (for a given treatment and genotype) ± se. For each genotype, IAA1 expression in the absence of added BR was normalized to 1. For each genotype, ANOVA analysis was undertaken to evaluate means separation between treatments (presence and absence of exogenous BR application). The asterisk above the bar representing the “+BR” treatment indicates a significant difference (at P < 0.05). A similar data presentation and ANOVA analysis of means separation was used for the experiments shown in Figures 7, 9, and 10 and Supplemental Figures S1 and S4. For this experiment, the expression of IAA1 in the absence of exogenous BR in leaves of bri1-5 plants was 0.39 relative to the level in wild-type plants.

