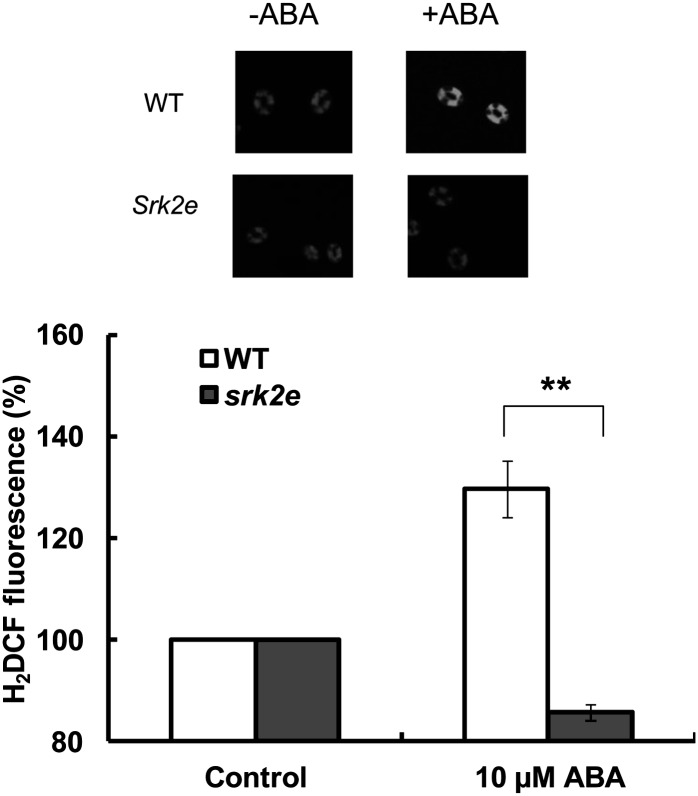
Figure 6.
ABA-induced ROS production in wild-type (WT) and srk2e guard cells. Representative grayscale H2DCF fluorescence images (top panel) and percentage of H2DCF fluorescence levels (bottom panel) are shown. Fluorescence intensities of ABA-treated cells are normalized to the control value taken as 100% for each experiment. Ten micromolar ABA or solvent control (0.1% ethanol) was added to the epidermal preparation for 20 min. Bars indicate averages of five independent experiments (n = 5; 100 total guard cells per bar). Asterisks indicate significant differences (**α = 0.01) by Student’s t test. Error bars represent se.

