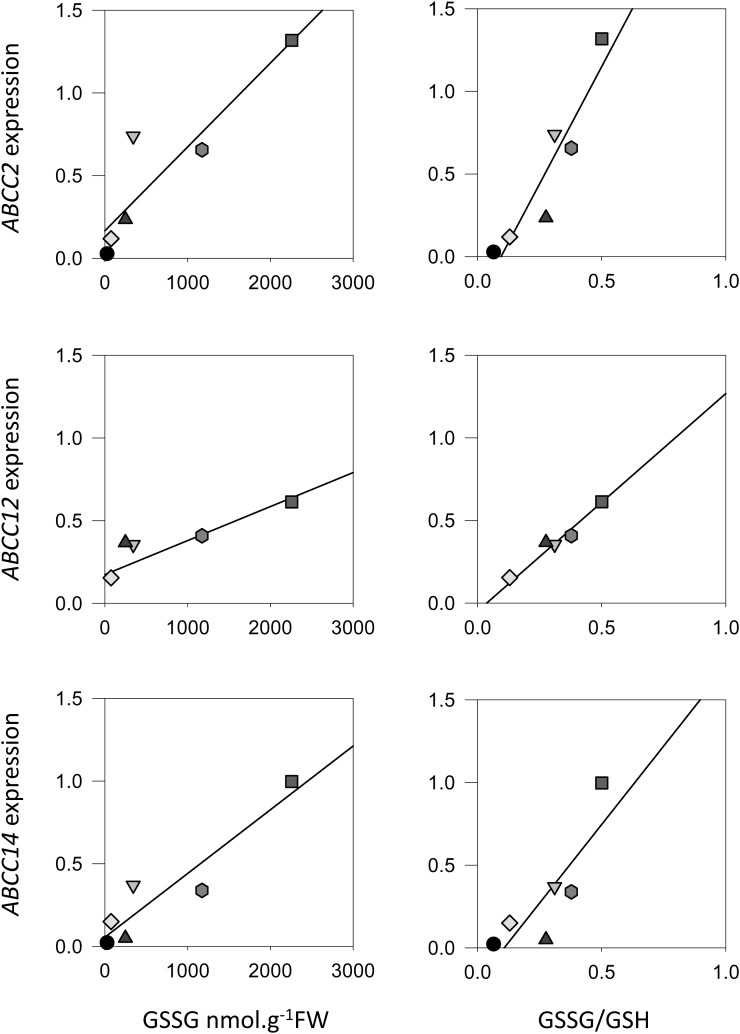
Figure 1.
Correlation between the expression of specific ABCCs and glutathione status in Arabidopsis lines. ABCC2, ABCC12, and ABCC14 transcript fold change (relative to Col-0) is plotted against GSSG (left) and GSSG-GSH ratio (right) in gr1, cat2, and cat2 gr1 lines. Glutathione was measured and microarray analysis was conducted as described by Mhamdi et al. (2010). FW, Fresh weight.

