Figure 2.
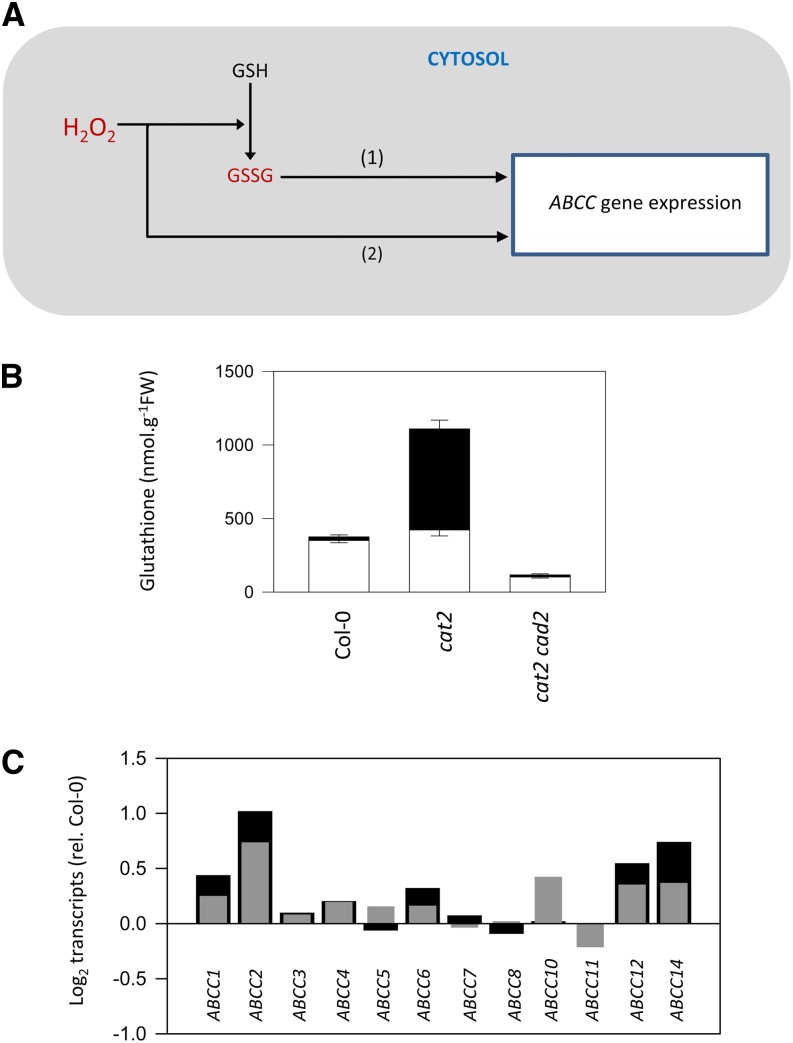
Control of oxidative stress-triggered ABCC expression by GSSG levels? A, Scheme showing oxidative stress induction of ABCCs by possible GSSG-dependent (1) and GSSG-independent (2) pathways. B, Glutathione status in Col-0, cat2, and cat2 cad2, in which H2O2-triggered glutathione synthesis is blocked (Han et al., 2013a). White bars, GSH; black bars, GSSG. Data are means ± se of three biological replicates. FW, Fresh weight. C, Comparison of ABCC induction in cat2 (gray bars) and cat2 cad2 (black bars). Data show fold change relative to Col-0.

