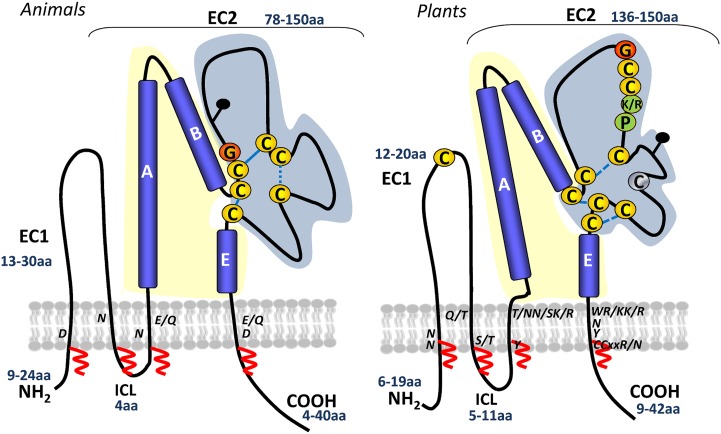
Figure 2.
Schematic representation of animal and plant tetraspanin topologies. A generic topology for animal tetraspanins is shown on the left (adapted from Hemler, 2005). A predicted plant tetraspanin topology is shown on the right, inferred from protein structure predictions and by comparison with the known topology of animal tetraspanins. Numbers in blue indicate the range of amino acids in the small extracellular loop (EC1), large extracellular domain (EC2), ICL, and C-terminal tail. Yellow and blue shading represent the variable and conserved domains of EC2, respectively. Conserved cysteines and the plant GCCK/RP motif in EC2 are marked. Cysteines in yellow are 100% conserved, and those in gray are 90% conserved. Conserved polar residues in the TM are indicated. Predicted disulfide bridges are shown with dashed blue lines. Potential palmitoylation sites in the transmembrane domains are indicated with red zigzag lines. Black pins indicate predicted glycosylation sites. [See online article for color version of this figure.]

