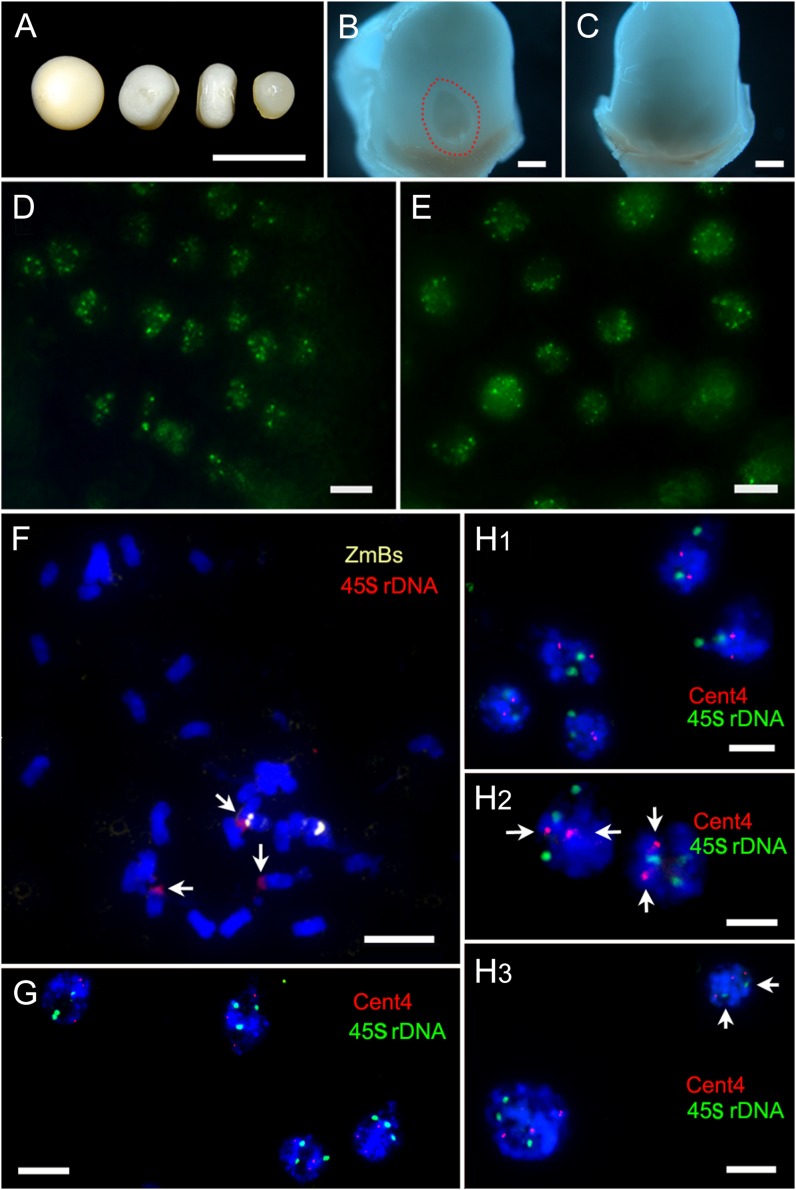
Figure 5.
Ploidy detection of aborted endosperm at different days after pollination. A to E are 13 DAP, F and G are 5 DAP, and H1 to H3 are 9 to 15 DAP. A, The first one was normal kernel and the others were defective kernels with different sizes. B, Enlarged view of the normal kernel in A with embryo (outlined with red), and the ovary wall was removed. C, Enlarged view of the defective kernel in A without embryo, and the ovary wall was removed. Bars = 500 μm. D, YFP signals in the endosperm of normal kernel. E, YFP signals in the endosperm of defective kernel. F, Spread of aborted endosperm at 5 DAP with three 45S rDNA (red, arrows) and two ZmBs (yellow). G, Interphase nucleus of an aborted endosperm at 5 DAP with three 45S rDNA (red) and three Cent4 (green). H1, Interphase nucleus of an aborted endosperm with two 45S rDNA (green) and two Cent4 (red). H2, An aborted endosperm with three 45S rDNA (green) and two Cent4 (red, arrows). H3, An aborted endosperm showed mixoploid. One cell showed three 45S rDNA (green) and three Cent4 (red); another cell showed two 45S rDNA (green, arrows) and three Cent4 (red). Bars = 10 μm

