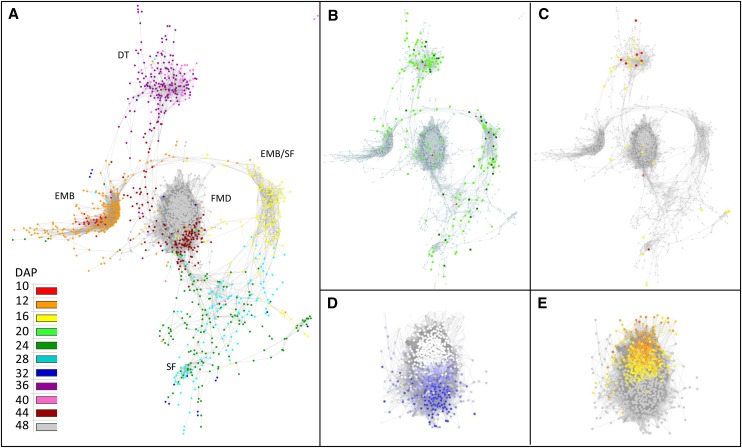
Figure 3.
Weighted gene coexpression gene network of seed development of M. truncatula. The edge adjacency threshold was set at 0.95 and visualized using an organic layout in Cytoscape. A, Temporal analysis of network modules was obtained by coloring each gene by its maximum expression along seed development. B, Projection of seed-specific probe sets (light green), seed-specific and legume-specific probe sets (dark green), and seed specific TFs (red). C, Distribution of probe sets linked to DT and LEA genes. Genes previously identified in relation to DT were derived from Buitink et al. (2006) and are projected in yellow on the transcriptional network. Genes encoding LEA proteins are indicated in red. D, Analysis of correlation between expression profiles and P50. The color intensity of the scale ranges from 0.99 (dark blue) to 0.85 (light blue). E, Analysis of expression profiles that correlate with abscission. The scale indicates the fold increase in gene expression between 40 and 48 DAP (i.e. during abscission) and ranges from 50-fold (orange) to 2-fold (yellow).

