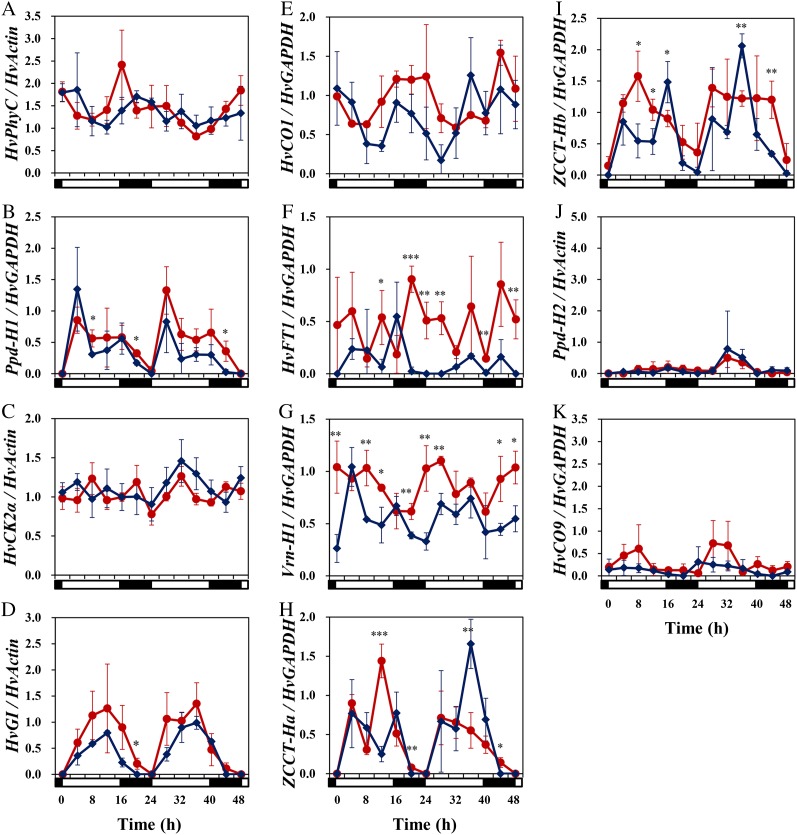
Figure 5.
Expression pattern of flowering-time genes under a long (16-h) photoperiod. Red circles and blue diamonds indicate NIL (HvPhyC-e) and NIL (HvPhyC-l), respectively. Expression level is the average of band intensity obtained by semiquantitative RT-PCR from three biological replications. White and black horizontal bars below each graph indicate light and dark conditions, respectively. Vertical bar indicates sd. Asterisks above plots indicate that the expression level was significantly different between two lines when they were compared at the same time points. Single, double, and triple asterisks indicate significance at P = 0.05, 0.01, and 0.001, respectively.

