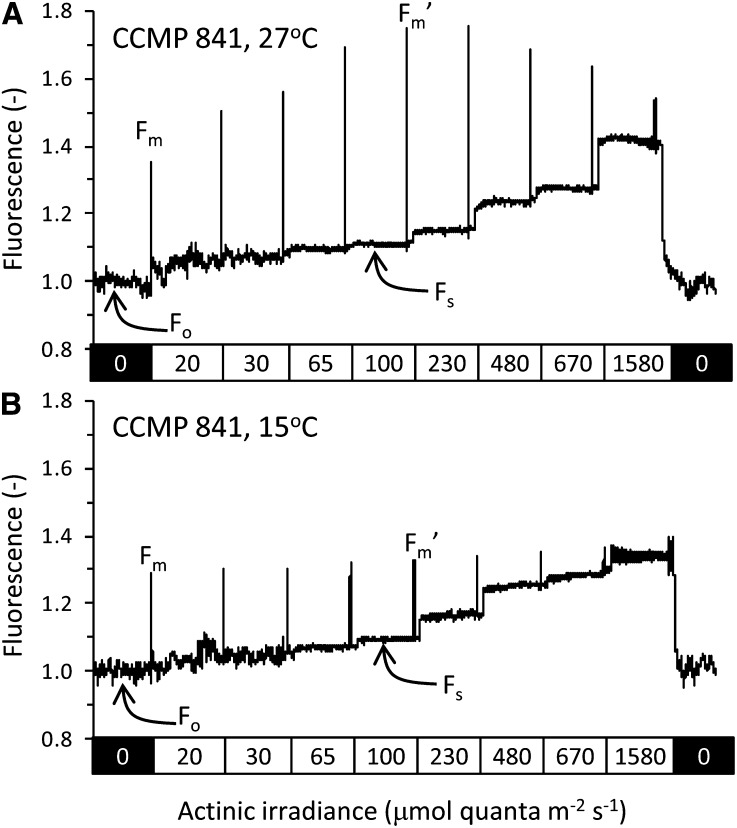
Figure 3.
Example fluorescence traces showing PSII fluorescence for strain CCMP841 at 27°C (A) and 15°C (B). Actinic irradiances are indicated in the rectangles below each trace, and exposure to each irradiance lasted 60 s. A saturating pulse 800 ms in duration was used to temporarily close all PSII reaction centers and eliminate photochemical quenching such that maximum fluorescence levels at each irradiance could be determined. The dark-adapted steady-state fluorescence (Fo), the fluorescence level following a saturating flash in the dark with no actinic light (Fm), the steady state fluorescence at a given actinic intensity (Fs), and the fluorescence level following a saturating flash in the presence of background actinic light (Fm′) are also labeled. Each actinic irradiance level has its own unique value of Fs and Fm′, but only the values for the actinic irradiance level of 100 μmol quanta m–2 s–1 are labeled in the figure. A strong state transition is apparent at 27°C for this strain at all actinic irradiances and can be identified from the higher Fm′ values as compared with the Fm value. This indicates movement of the PBS from PSI in the dark to PSII in the light, causing increased PSII fluorescence. The effect is much less pronounced for cells grown at 15°C, where Fm and Fm′ levels are more similar.

