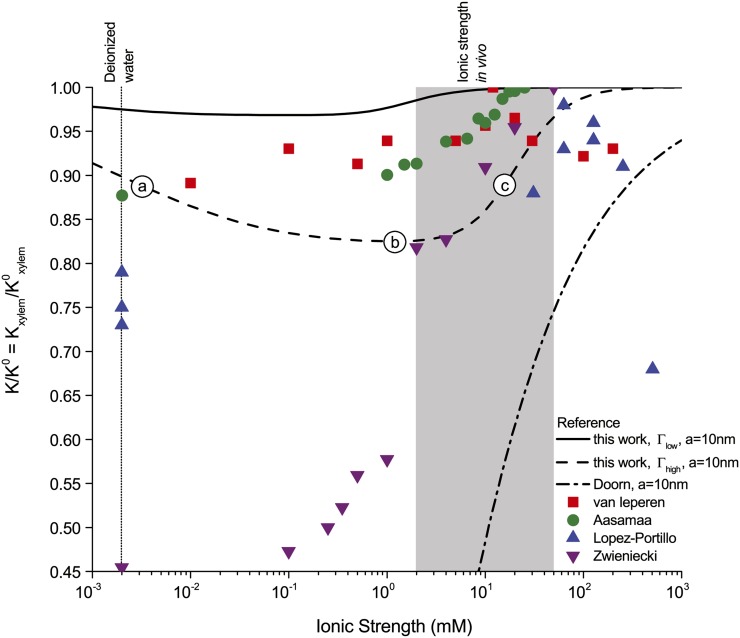
Figure 6.
Relative hydraulic conductance ( ) versus ionic strength (
 ) for our theoretical predictions, van Doorn’s model, and published experimental data. Theoretical models shown (10-nm pore radius and KCl electrolyte): this work, density of chargeable sites
  (solid line); this work,
  (dashed line); and van Doorn et al. (2011), dash dot line). Experimental data shown (species, electrolyte, and figure in reference): (1) Chrysanthemum and KCl (Fig. 3 in van Ieperen et al., 2000; red squares); (2) Q. robur with petioles and various salt solutions (Fig. 1A in Aasamaa and Sõber, 2010; green circles); (3) C. erectus and NaCl, (Fig. 3 in López-Portillo et al., 2005; blue triangles); (4) L. nobilis, KCl, and average value of
  (Fig. 1C in Zwieniecki et al., 2001; purple triangles). Experimental data were normalized to the largest measured conductance in the particular species and report. [See online article for color version of this figure.]

