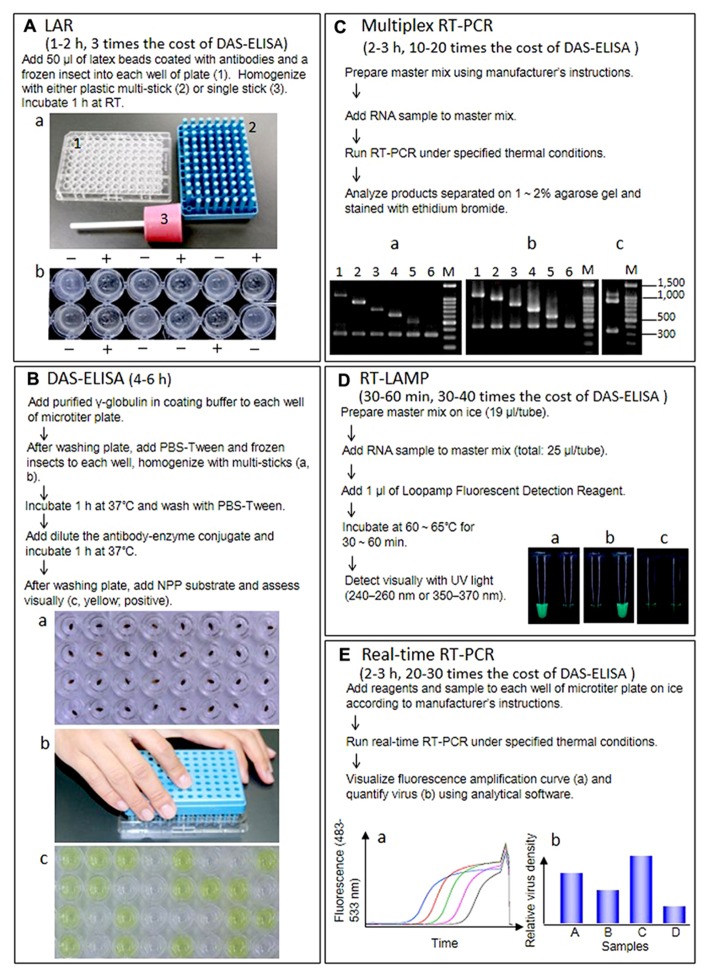
FIGURE 1.
Outline of procedure, required time, cost comparison of reagent kits per diagnosis, and results of five techniques. (A) Latex agglutination reaction (LAR) to detect RSV in insect vectors. RT, room temperature. (a) Materials for LAR and DAS-ELISA. (1) Microtiter plate, (2) multi-sticks, (3) single stick. (b) Results of LAR. +, positive, -, negative. (B) DAS-ELISA to detect RSV in insect vectors. (a) The frozen insects in each well. (b) Homogenization of insects with multi-sticks. (c) Visual assessment. (Yellow; positive). (C) Multiplex RT-PCR to detect and distinguish 10 rice viruses. (a) Agarose gel electrophoresis of RT-PCR products from healthy or infected rice plants using primer set I. Lane 1, infected with RDV (1106 bp); lane 2, infected with RSV (917 bp); lane 3, infected with RBSDV(734 bp); lane 4, infected with RTYV (631 bp); lane 5, infected with RTSV (504 bp); lane 6, healthy plant (339 bp). (b) Agarose gel electrophoresis of RT-PCR products from healthy or infected rice plants using primer seII. Lane 1, infected with SRBSDV (1097 bp); lane 2, infected with RGDV (994 bp); lane 3, infected with RRSV (834 bp); lane 4, infected with RTBV (699 bp); lane 5, infected with RGSV (574 bp); lane 6, healthy plant (419 bp). (c) Agarose gel electrophoresis of RT-PCR products from rice plants infected with RDV and RSV. (D) RT-LAMP to detect and distinguish between SRBSDV and RBSDV. (a) Rice plants infected with SRBSDV. (b) Rice plants infected with RBSDV. (c) Healthy rice plants. Left, SRBSDV primer sets. Right, RBSDV primer sets. (E) Real-time RT-PCR to quantify SRBSDV in rice and insect vectors. (a) Samples with a higher density of virus yield an earlier rise in the fluorescence amplification curve, which corresponds to the density of RT-PCR products. The threshold cycle (Ct), calculated from the amplification curve, is used as an indicator of virus titer in the sample (higher virus titer results in lower Ct). (b) Virus titer is usually given as the relative density of virus titer to expression of a housekeeping gene (e.g., actin and ubiquitin) from the host or vector.

