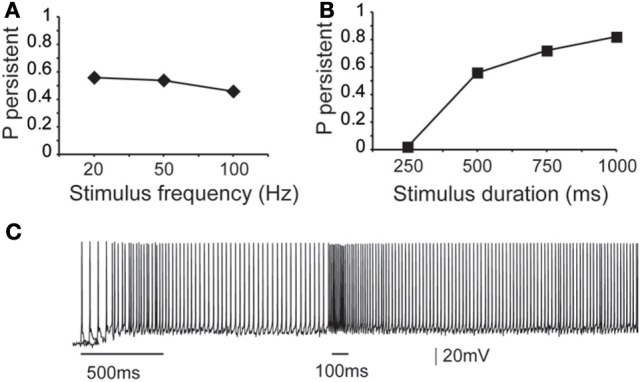
Figure 3.

Dependence of microcircuit spiking activity on stimulus-specific parameters. (A) Graph showing the effect of stimulus frequency (20, 50, 100 Hz) on the probability of persistent activity initiation. Parameters used: iNMDA-to-iAMPA ratio = 2.3, iGABAB-to-iGABAA ratio = 0.4, dADP deactivated. (B) Graph showing the effect of stimulus Duration (250 ms, 500 ms, 750 ms, 1 s) on the probability of persistent activity initiation. Parameters used: iNMDA-to-iAMPA ratio = 2.3, iGABAB-to-iGABAA ratio = 0.4, dADP deactivated. (C) Indicative voltage trace showing the effect of a second excitatory stimulus (100 Hz, 10 events) to the pyramidal neurons. Bars indicate stimulus presentation times.
