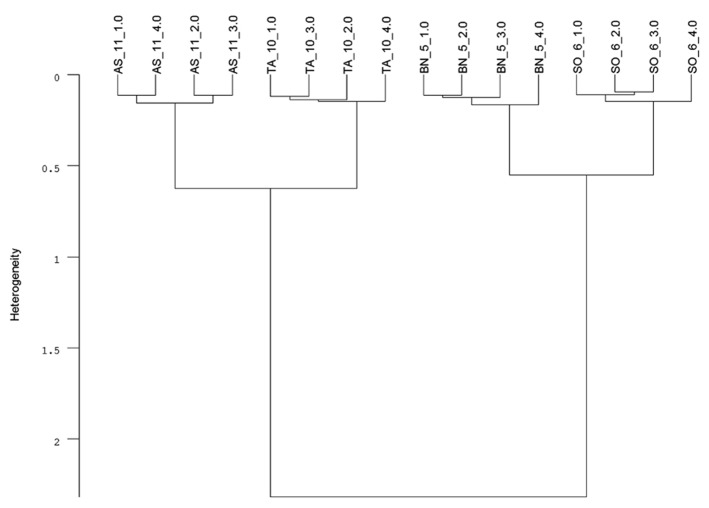
FIGURE 2.
Cluster analysis of FT-MIR–ATR spectra (Figure 1) recorded from dried, ground roots of Triticum aestivum (TA), Apera spica-venti (AS), Brassica napus (BN), and Sisymbrium officinale (SO) grown in a greenhouse experiment. Data were pre-processed by first derivative and vector normalization. Spectral distances were calculated by Euclidean distance and Ward’s algorithm in the frequency range of 374–3999 cm-1 (mean, n = 4; C. Meinen, unpublished data).

