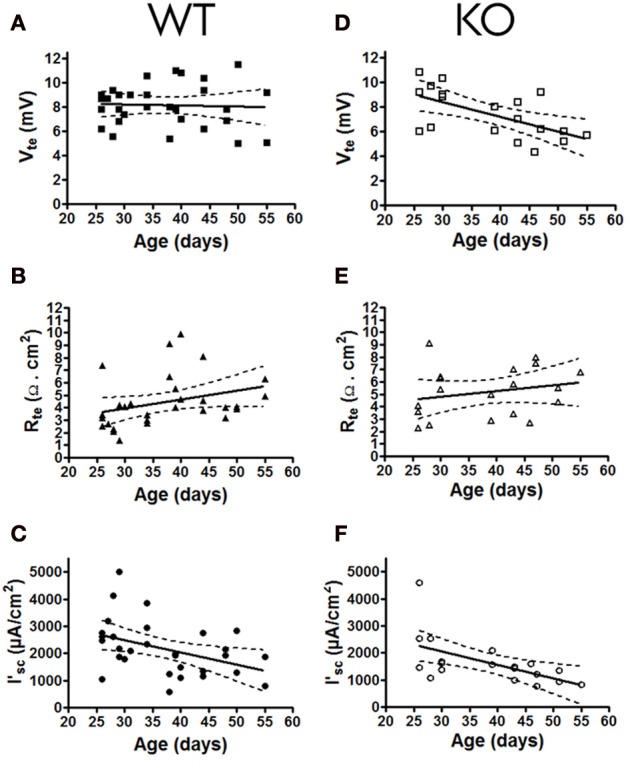
Figure 2.

Basal transport values (Vte, Rte, and I'sc) of mouse mTALs plotted as a function of age (in days) of P2Y2 receptor WT (A, B, C; n = 30) and KO (D, E, F; n = 19) mouse. All 6 data panels include regression line fits where the stippled lines indicate the 95% confidence intervals.
