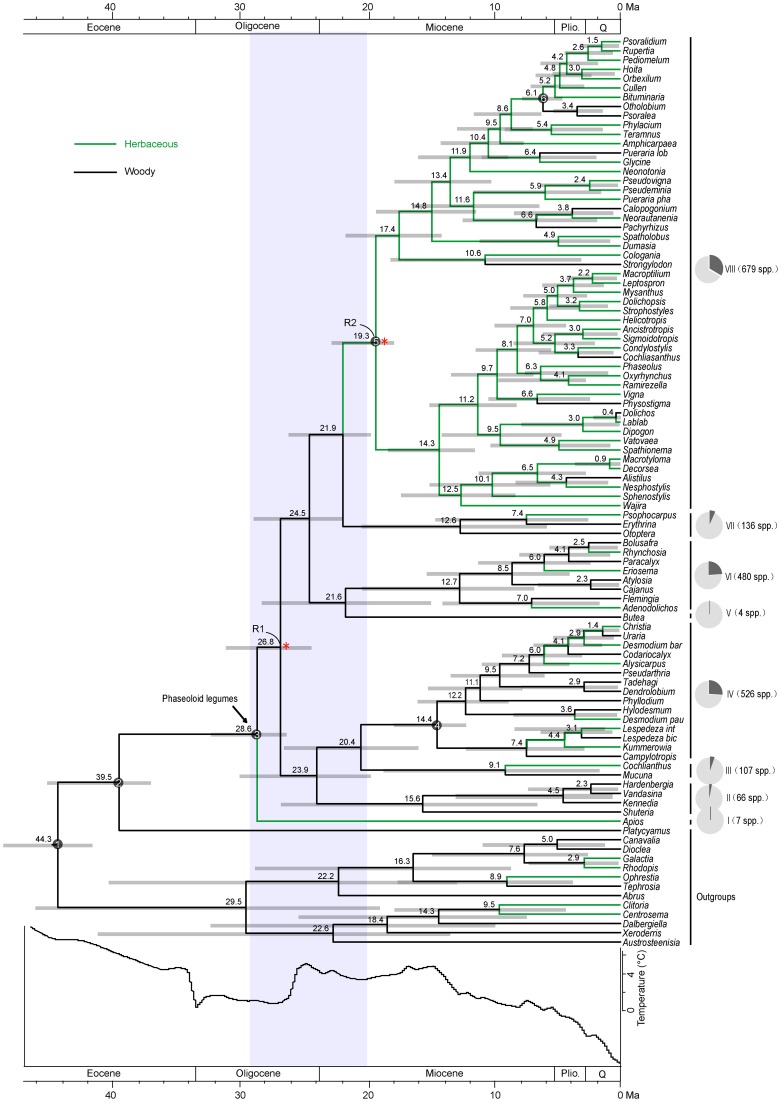
Figure 1.
Combined chronogram and habit shift analysis of the phaseoloid legumes. Numbers above branches are divergence times estimated using BEAST. Gray bars show 95% credibility interval. White numbered nodes represents the calibration node. Red asterisks indicate the nodes (R1, R2) with significant rate increases. Shaded area at the base of the tree highlights initial diversification event. Pie charts represent the proportion of extant phaseoloid species in each clade. The depiction of sea-surface temperature changes is modified from Zachos et al. (2001).

