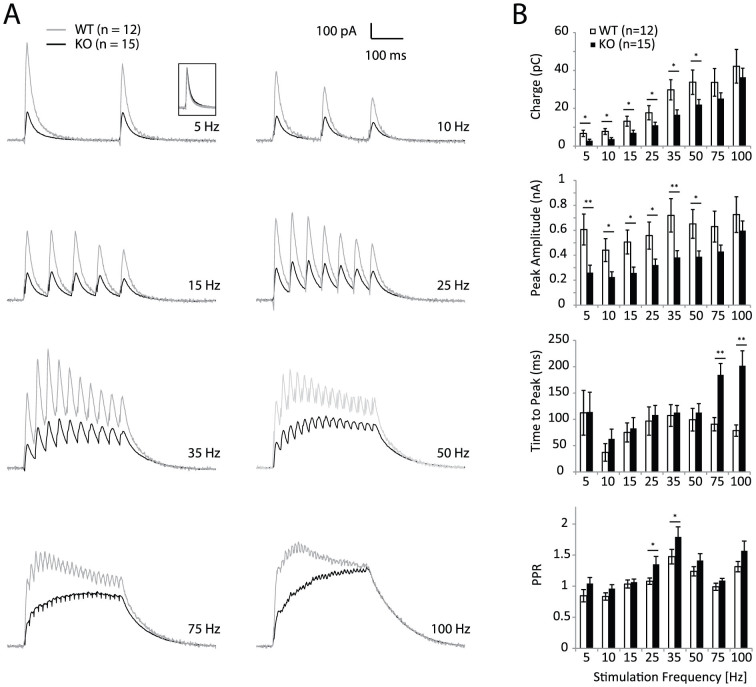
Figure 2. Inhibitory Components of Network Response.
(A): Averaged network response to frequency stimulation recorded in L2/3 pyramidal cell in voltage-clamp mode (V = +10 mV). WT: 12 cells (grey), KO: 15 cells (black), each cell response is an average of 5 repetitions. Inset: scaled and overlaid averaged waveforms. (B): Network response properties (top to bottom): total charge, peak response amplitude, time to peak, and paired-pulse ratio (PPR).

