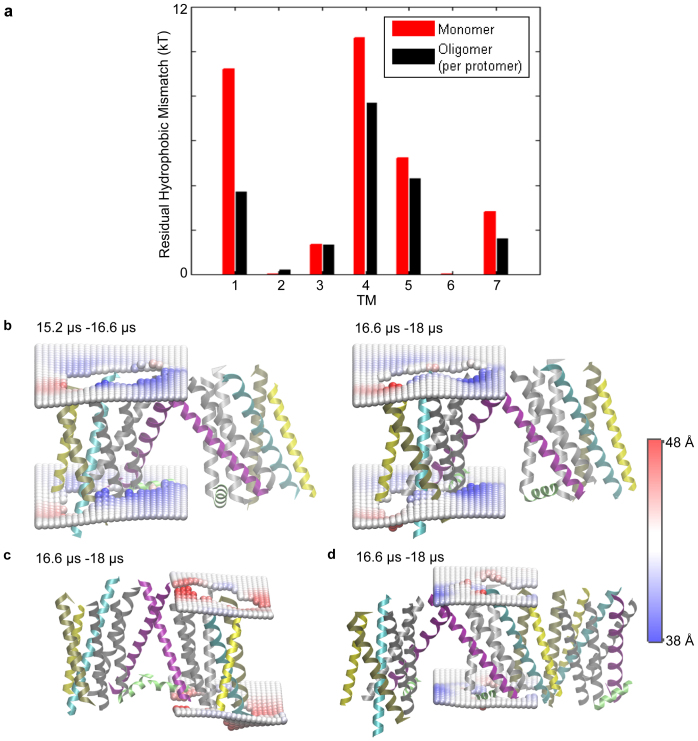
Figure 2. Lipid-protein interactions in the oligomers.
(a) The average energy cost of residual hydrophobic mismatch (RHM) for each TM of β2AR embedded in the POPC membrane bilayer, calculated for a protomer in the oligomeric arrays (in black), and compared to that calculated for the monomeric protein (in red). (b–d) Deformation of the membrane upon β2AR oligomerization. Two profiles are shown in (b), one calculated from the 1.4 μs segment of the trajectory (on the right), and the other from the preceding 1.4 μs segment of the trajectory (on the left); note the similarity which substantiates the robustness of the calculated membrane response observed in all cases. The time-averaged membrane thickness profiles are shown around a protomer that forms a loosely packed TM1-TM1 dimerization interface at one end of an oligomeric array, in (b); around a protomer that forms a tightly packed TM1/H8-TM1/H8 dimerization interface at one end of another oligomeric array, in (c), and around a protomer that interacts with two other GPCRs, forming both a TM1-TM1 interface and a TM5-TM5 interface, in (d). The interacting protomers are taken from simulation snapshots and shown in cartoon representation, with TM1 colored in purple, TM3 in cyan, TM4 in yellow, TM5 in tan, and other TMs in silver. H8 is shown in green color. The membrane deformations were quantified relative to the particular protomer in question, with the trajectory being centered at the protomer. These are shown as time-averaged surfaces composed of phosphate headgroups around the protein calculated on a 2 Å * 2 Å grid, with the color scheme indicating membrane thickening (in red) and thinning (in blue).

