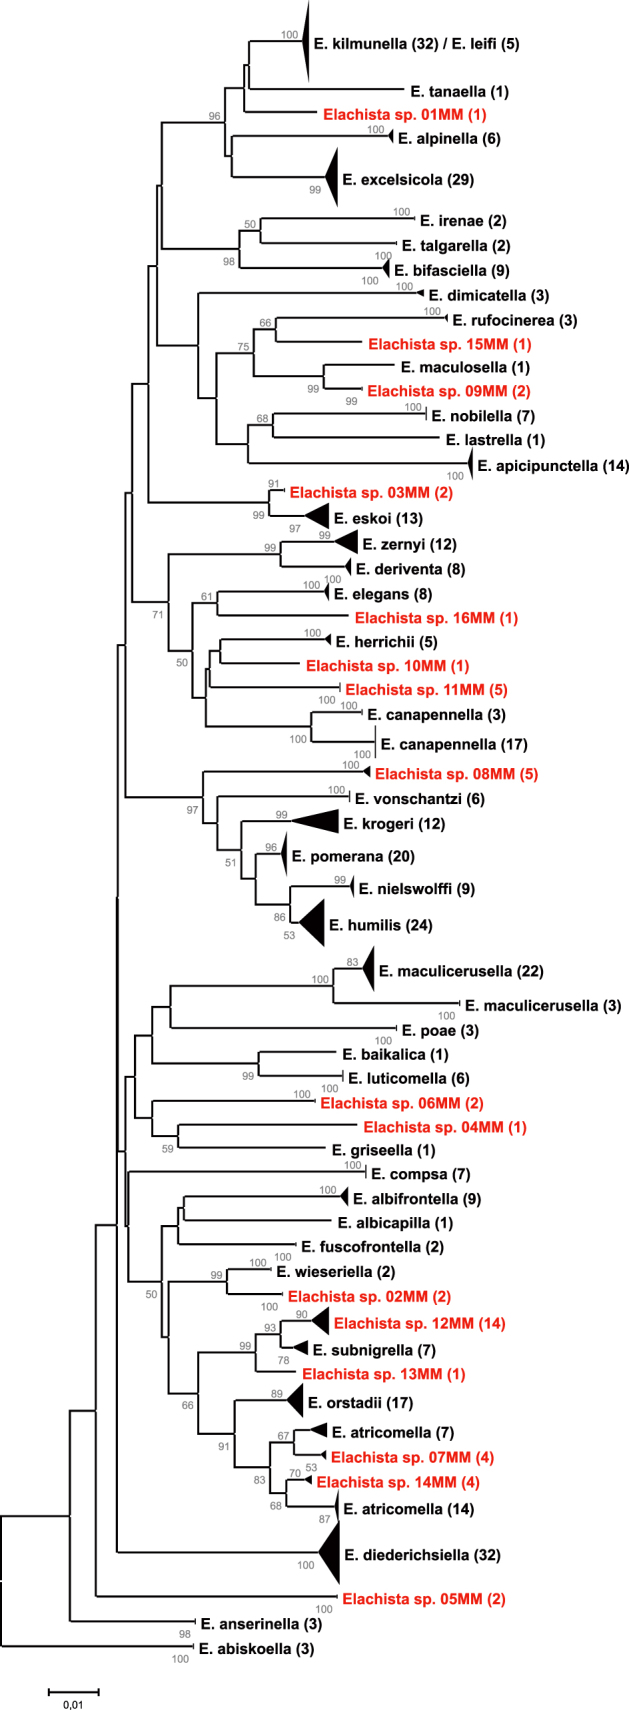
Figure 2. A Neighbor-Joining tree, generated under the K2P nucleotide substitution model, of the study taxa.

Node bootstrap support values of >50% are indicated. Sample size for each species is indicated in parentheses after species names. The height of terminal triangles is proportional to sample size, the depth to degree of intraspecific variation. Deep (>2%) intraspecific splits are shown separated. Newly discovered species are highlighted in red.
