Figure 2.

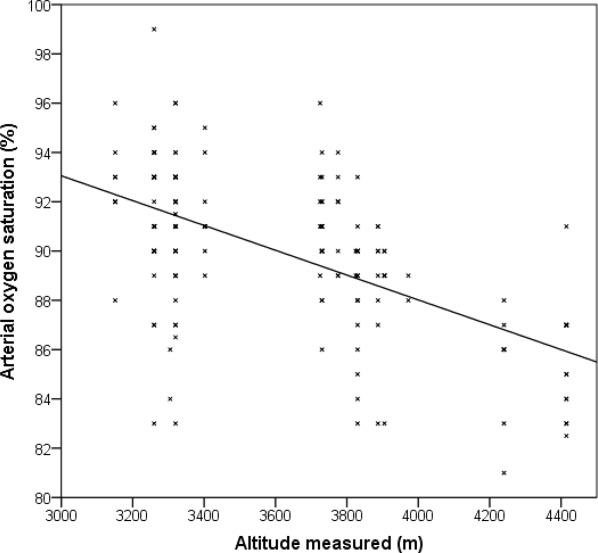
Scatter plot of peripheral arterial oxygen saturation (SpO2) against altitude where measurements were taken, demonstrating the expected decrease in SpO2 with increasing altitude.

Scatter plot of peripheral arterial oxygen saturation (SpO2) against altitude where measurements were taken, demonstrating the expected decrease in SpO2 with increasing altitude.