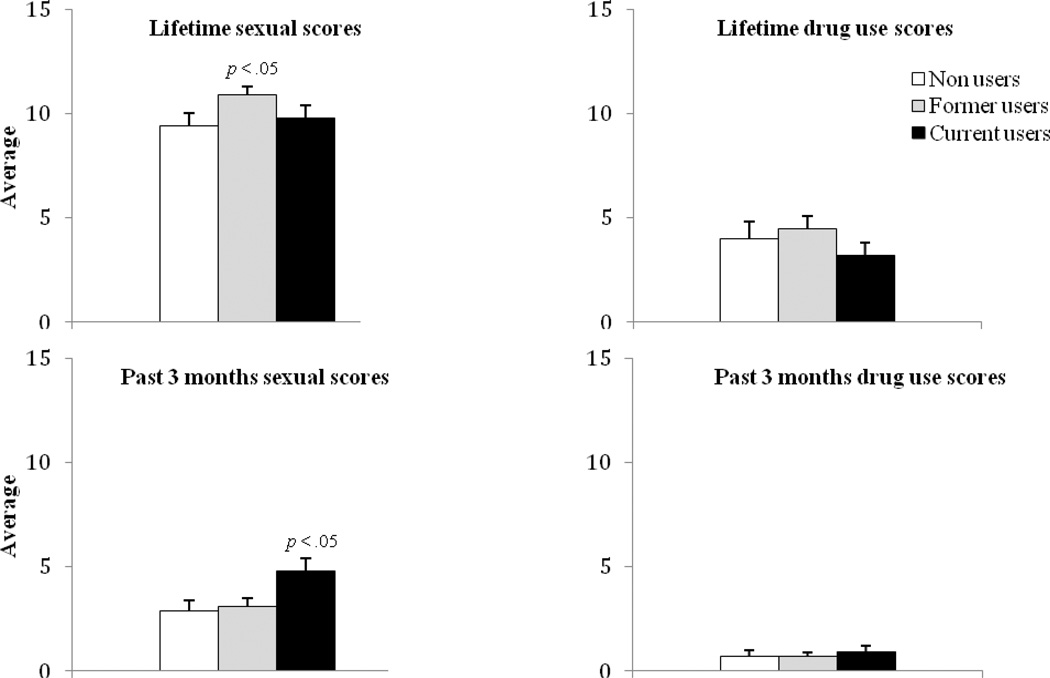
Figure 1.
Average subscale scores obtained in the lifetime and past 3- month of the HIV Risk Behavior Scales. Graphs on the top depict lifetime sexual and injection drug use subscale scores, and graphs on the bottom depict past 3 months sexual and injection drug use subscale scores. Never marijuana users are shown in open bars, former marijuana users in lightly shaded bars, and current users in black bars. Error bars depict standard errors. The “p < .05” refers to results from multivariate analyses of variance evaluating omnibus differences between the three marijuana using groups.

