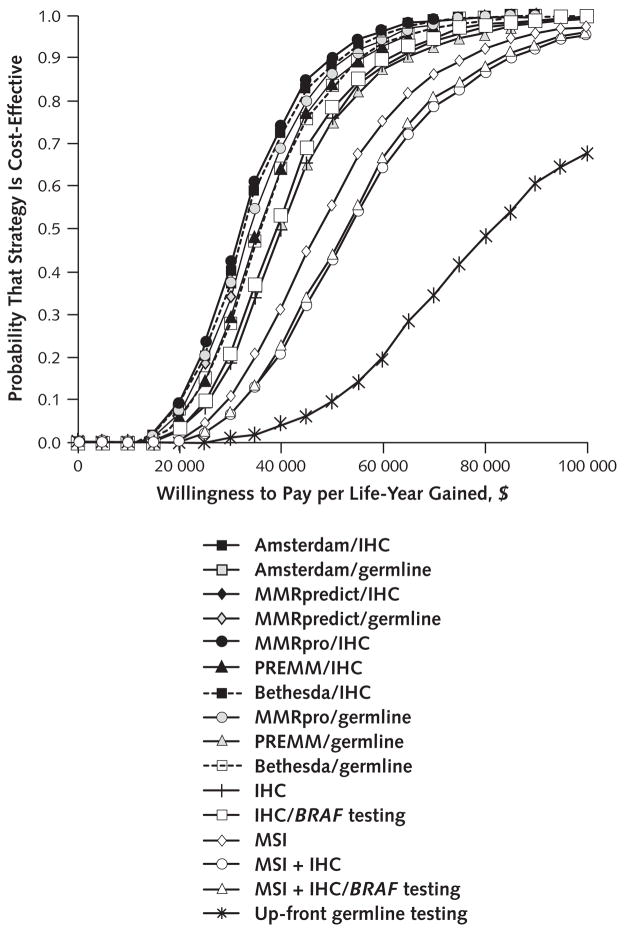
Figure 3. Cost-effectiveness acceptability curves for all strategies, constructed from probabilistic sensitivity analyses.
For any given strategy, a higher willingness to pay per life-year gained meant a higher probability that the strategy was considered cost-effective. All strategies are compared with the referent strategy. IHC = immunohistochemistry; MSI = microsatellite instability.

