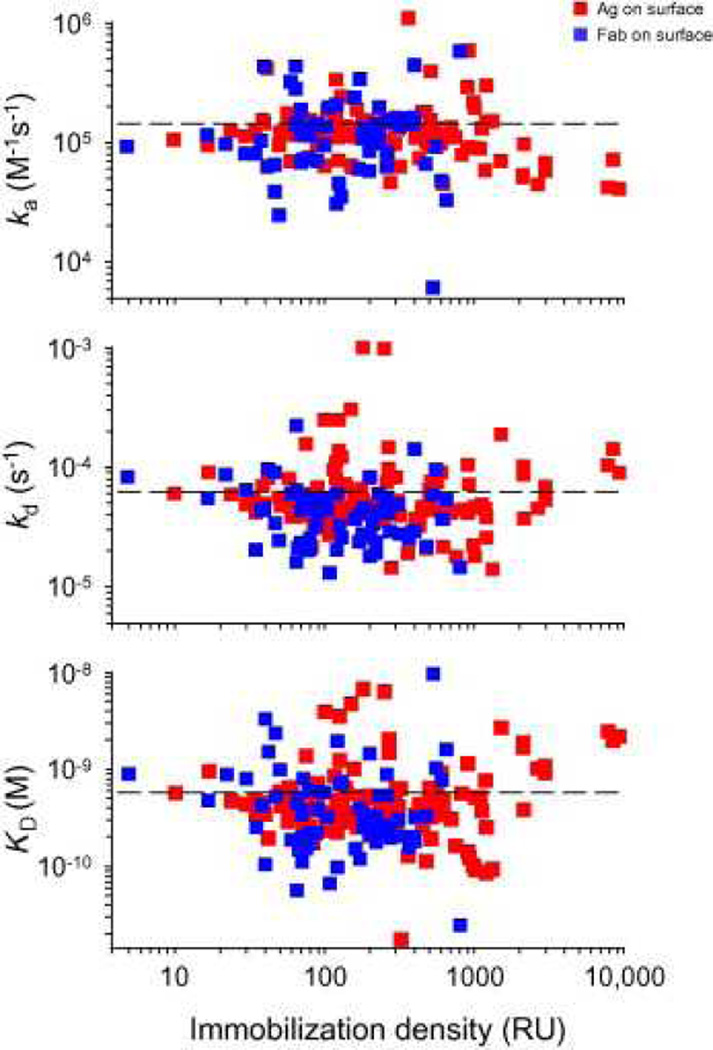
Fig. 11.
Kinetic parameters plotted against immobilization density. Ag surfaces are indicated in red, and Fab surfaces are indicated in blue. In each panel, the dashed line indicates the average determined value. RU, resonance units. (For interpretation of color mentioned in this figure the reader is referred to the web version of the article.)

