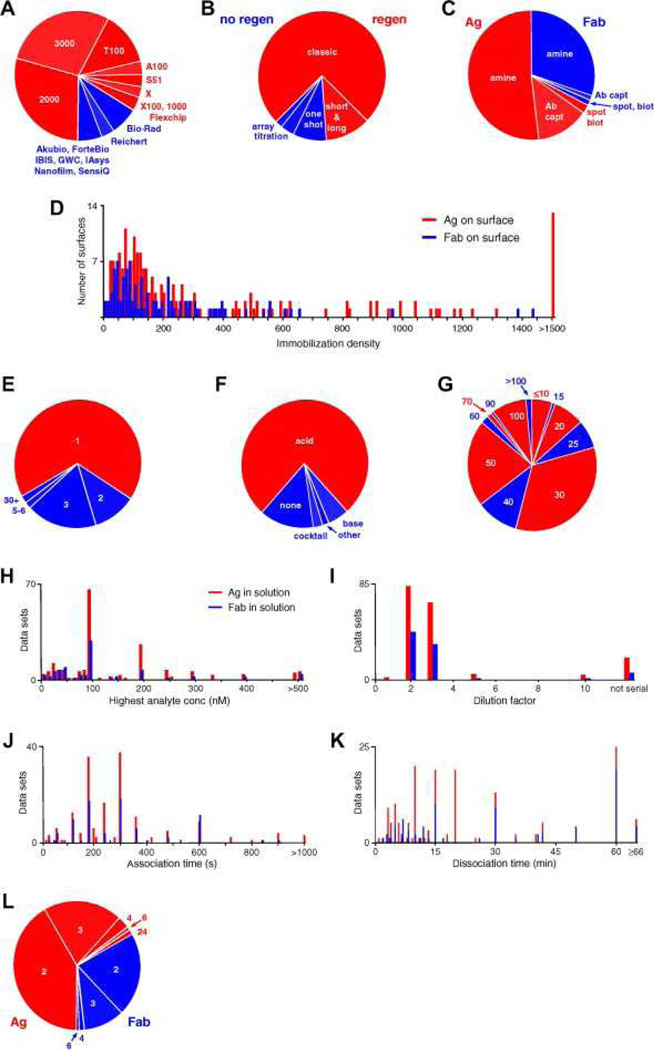
Fig. 2.
Participants’ experimental parameters. (A) Instruments used, with Biacore platforms indicated in red and other manufacturers’ platforms indicated in blue. (B) Assay formats, with those requiring surface regeneration in red and other formats in blue. (C) Immobilized binding partners and tethering methods, with Ag as the ligand in red and Fab as the ligand in blue. (D) Immobilization densities for the Ag (red) and Fab (blue) from experiments performed using Biacore and Bio-Rad platforms. (The other technologies report responses in units other than resonance units [RU].) (E) Numbers of surfaces prepared. Analyses of two or more surfaces are shown in shades of blue. (F) Regeneration conditions, with nonacidic conditions shown in blue. (G) Flow rates used during analyte binding studies. (H) Highest analyte concentrations. (I) Dilution factors. (J) Lengths of analyte injection time. (For the ForteBio experiments, this corresponds to the time that the ligand-immobilized tips were immersed in analyte-containing wells.) (K) Lengths of time that the dissociation phase was monitored (dissociation was not monitored in the IAsys experiment.) In panels H–K, red bars represent parameters for Ag as the binding partner in solution and blue bars represent Fab in solution. (L) Numbers of replicates when Ag (red) and Fab (blue) were the binding partners in solution. (For interpretation of color mentioned in this figure the reader is referred to the web version of the article.)

